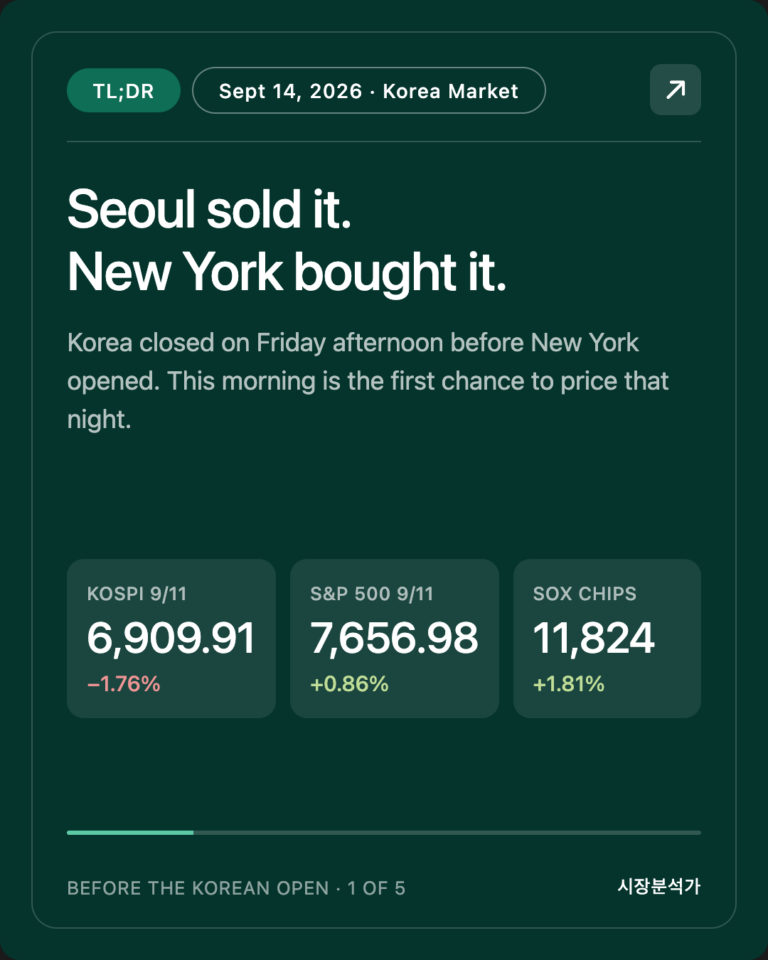
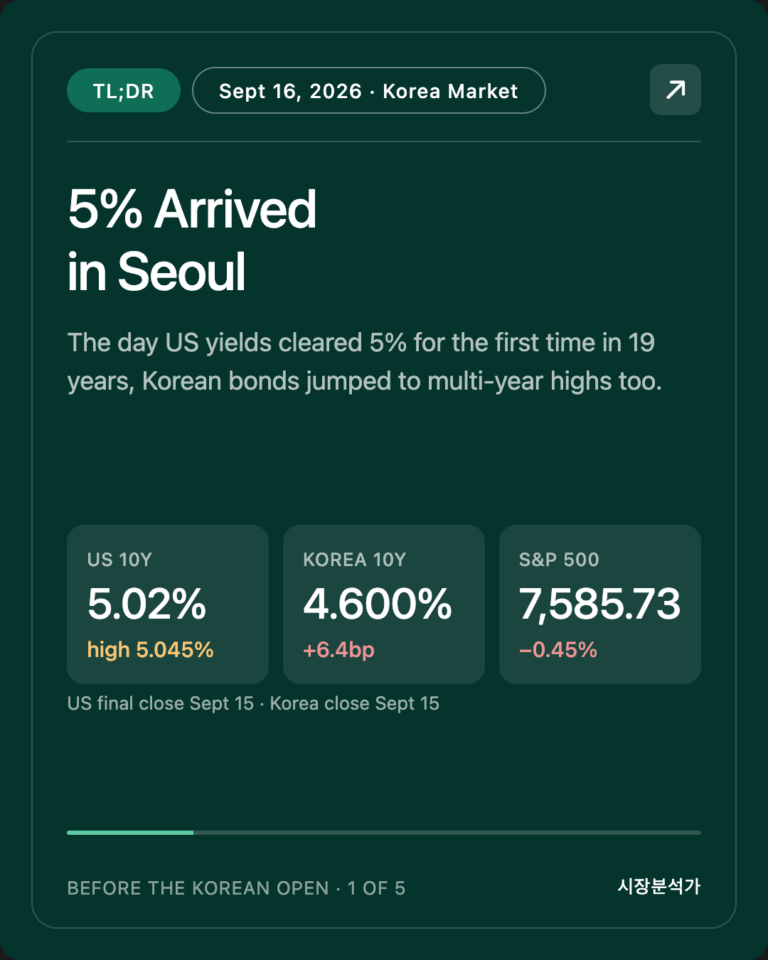
September 8, 2026 KOSPI Market Brief — What to Watch Before the Korean Open
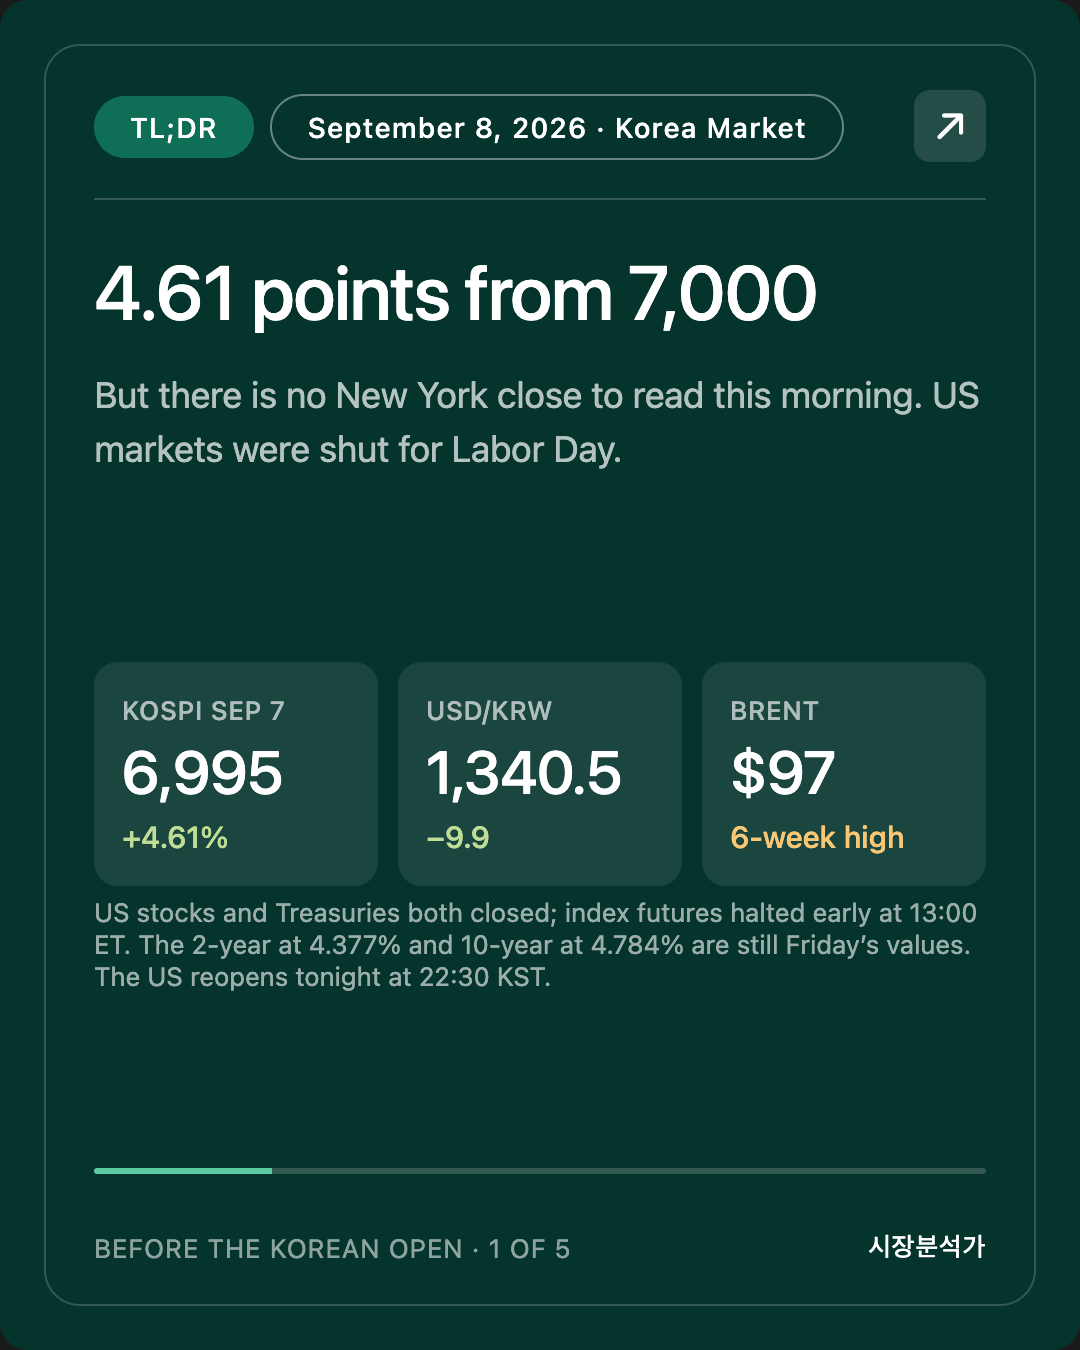
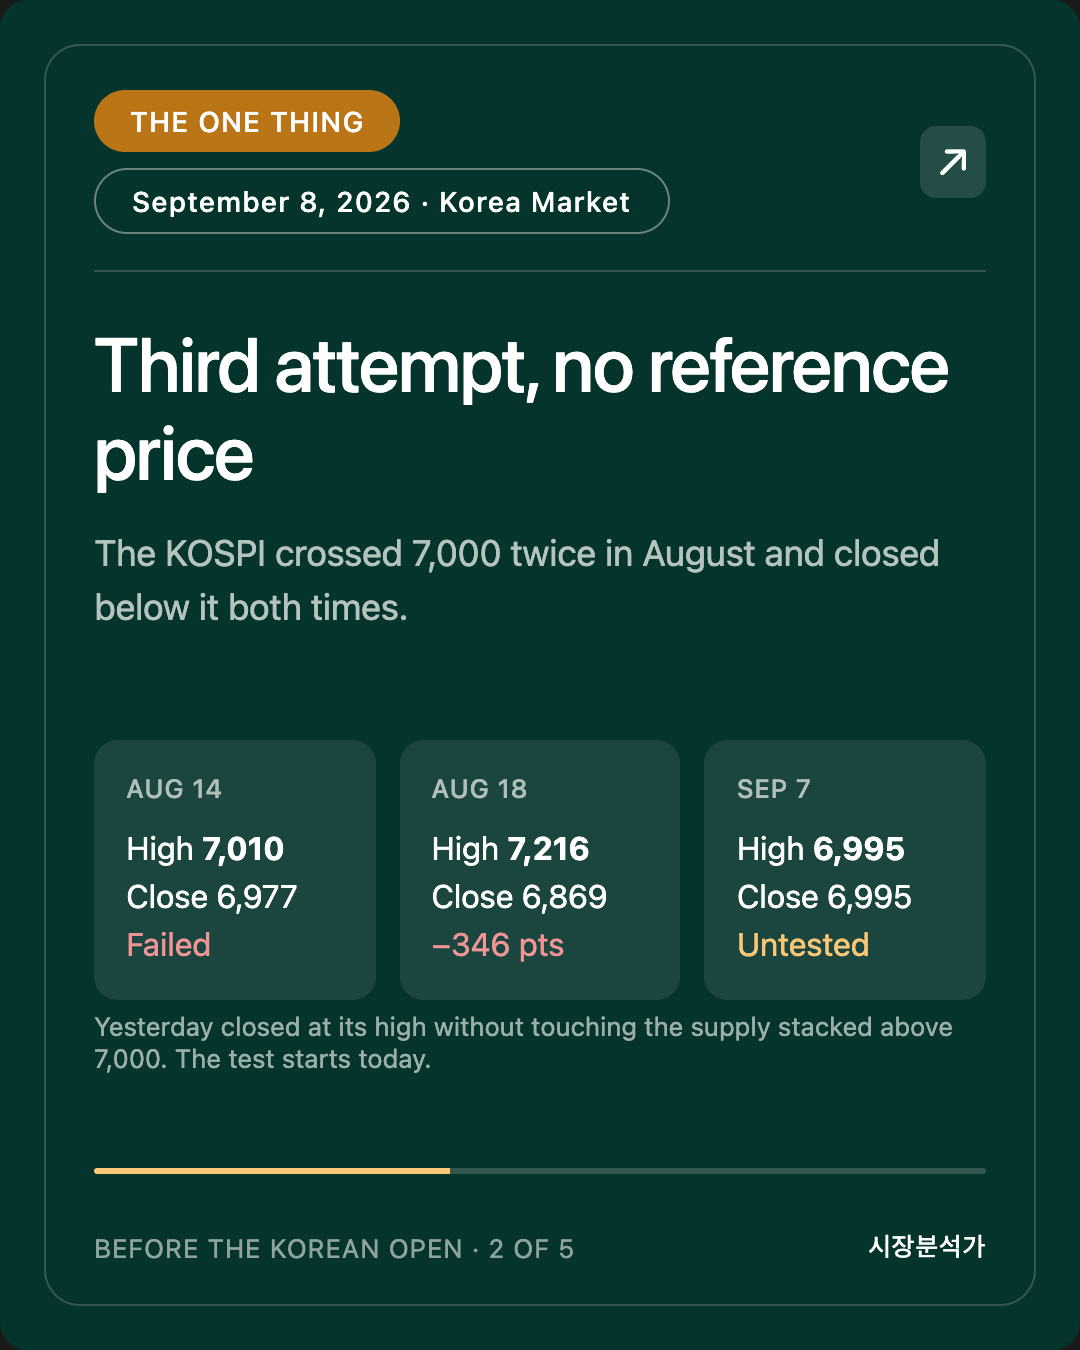
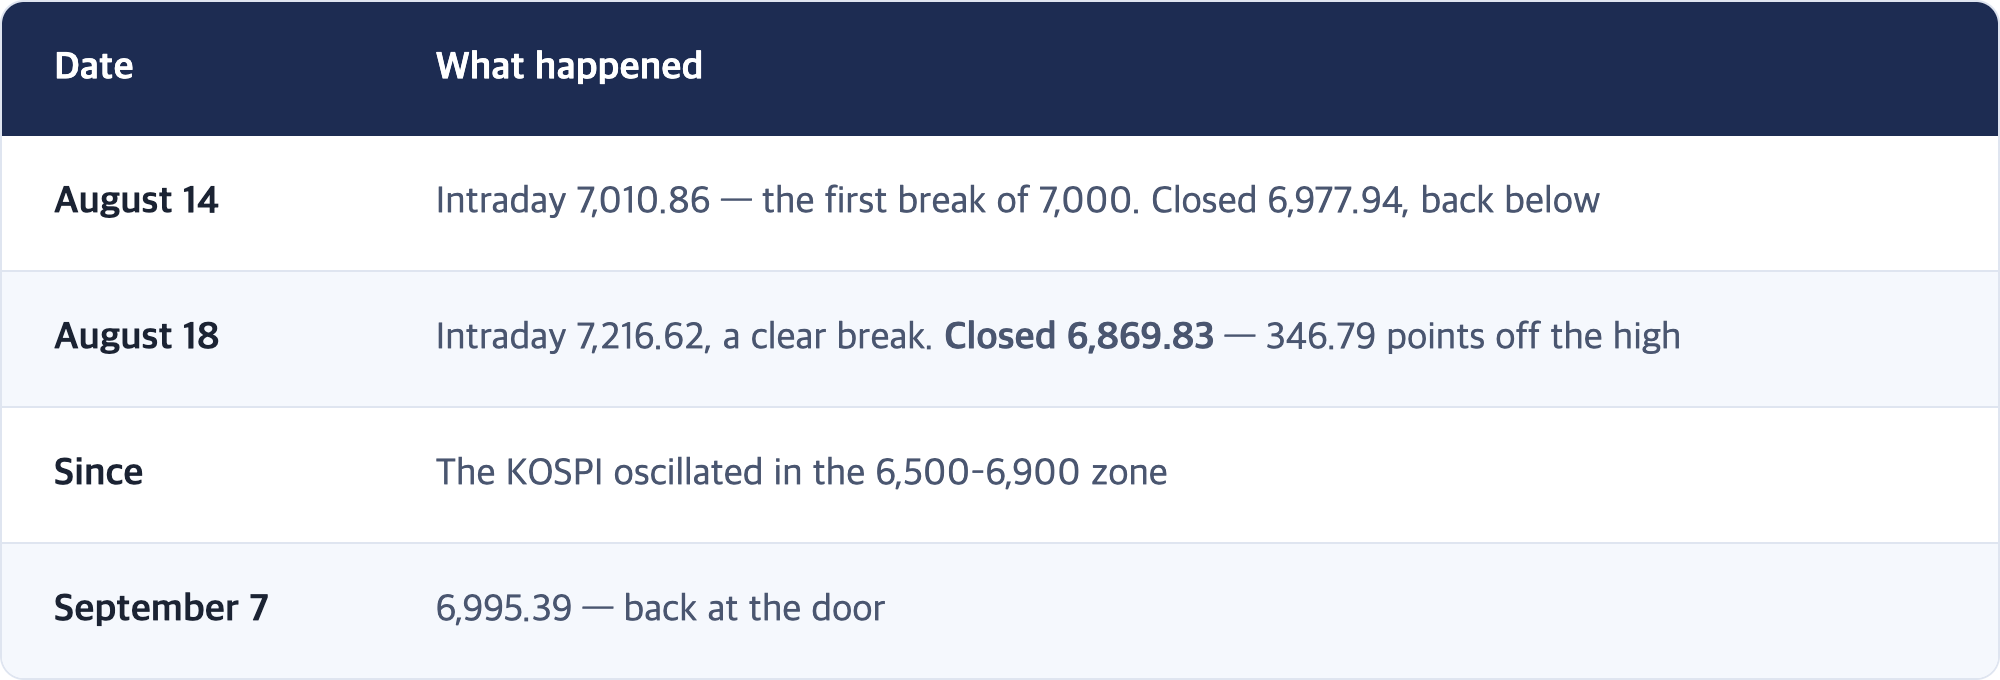
- The KOSPI starts today at 6,995.39, making its third run at 7,000. The first two were August 14 (intraday 7,010.86 → close 6,977.94) and August 18 (intraday 7,216.62 → close 6,869.83). Neither held.
- US stocks and Treasuries were both closed overnight. Even equity index futures halted early, at 13:00 ET. Korea trades this session without an overnight benchmark.
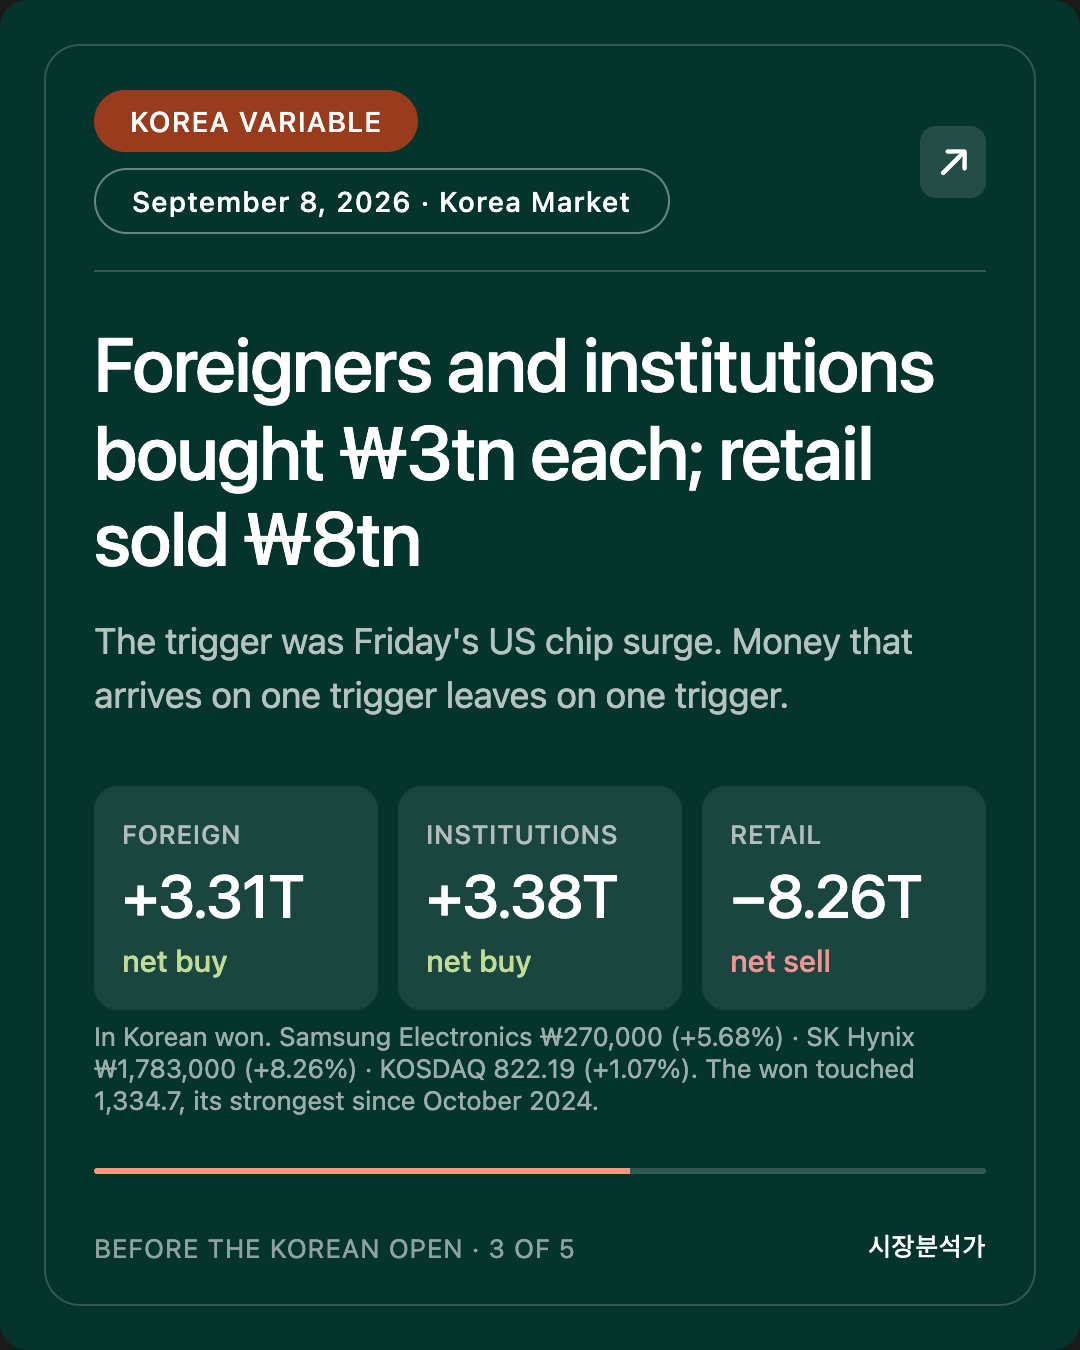
- Korea rose 4.61% alone yesterday. Foreign investors bought a net ₩3.31 trillion and institutions ₩3.38 trillion, while retail investors sold a net ₩8.26 trillion. Samsung Electronics closed at ₩270,000 (+5.68%) and SK Hynix at ₩1,783,000 (+8.26%).
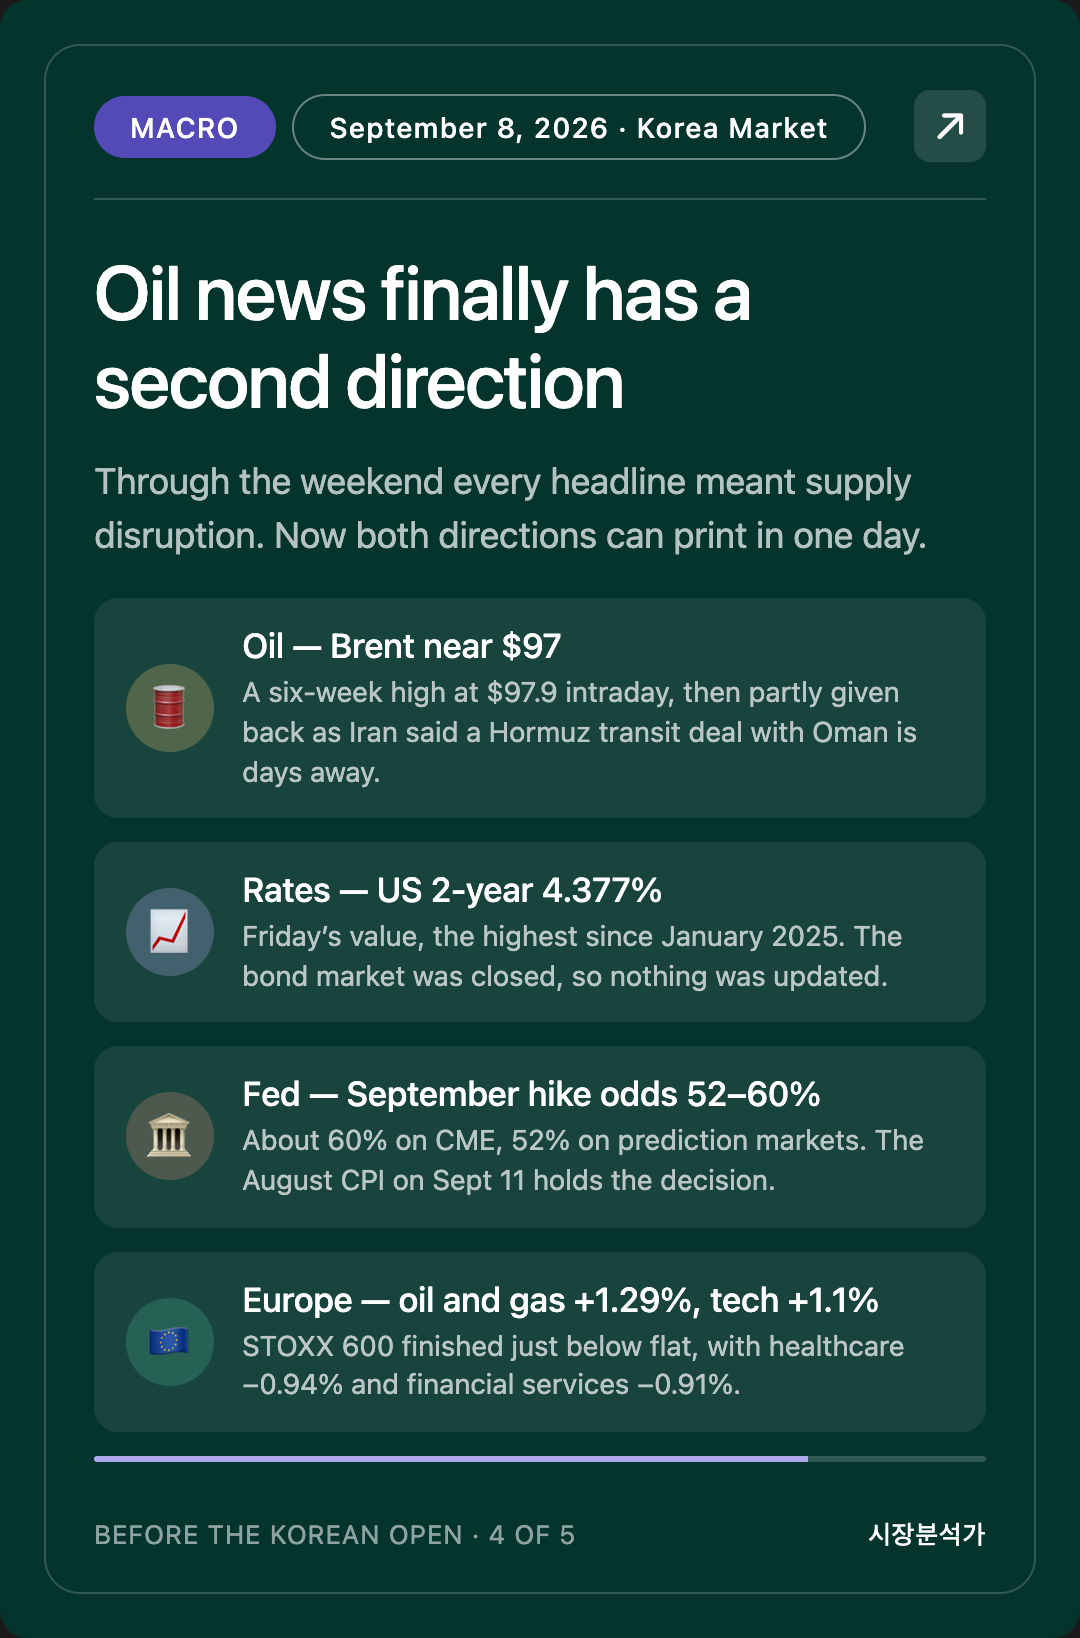
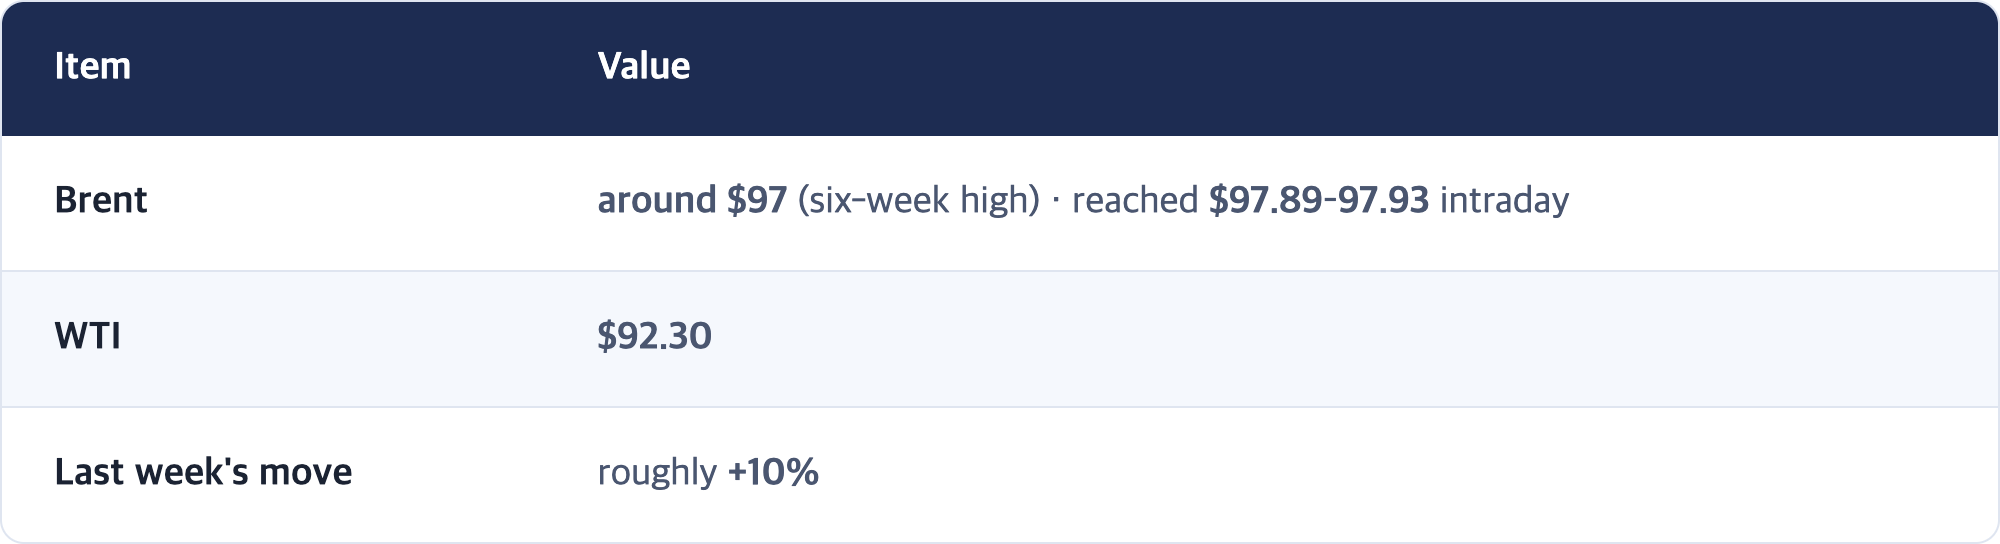
- Oil changed direction once overnight. Brent touched a six-week high near $97.9 before giving back some of the move when Iran said a Strait of Hormuz transit agreement with Oman is days away. For the first time in this cycle, the geopolitical premium can move both ways.
- The week's center of gravity is the US August CPI on September 11. September hike odds are split — roughly 60% on CME FedWatch versus 52% on prediction markets. The FOMC meets September 15–16.
This is Mr. Can. Here is the September 8, 2026 brief ahead of the Korean market open.
Written: September 8, 2026, 08:05 KST (Vancouver: Sept 7, 16:05 PDT)
Covers: US Labor Day closure (Sept 7) + European close of Sept 7 + Asian close of Sept 7
⚠️ US equity and bond markets were closed overnight for Labor Day. There is no New York close to reference this morning. US regular trading resumes tonight at 22:30 KST.
Intro
Korea's KOSPI opens this morning at 6,995.39. That is 4.61 points below 7,000.
One condition is different today. The United States was shut. Labor Day closed both the stock market and the bond market, so neither produced a price. The overnight New York close — the reference sheet a Korean trading day normally starts from — does not exist this morning.
This is not the KOSPI's first visit to 7,000. It crossed the line twice in August and failed to hold it both times. On August 18 the index reached an intraday 7,216.62 and closed at 6,869.83, giving back 346.79 points from the high inside a single session.
So the third attempt begins with no reference price. Here is what to watch.
1. The One Thing That Matters — a 7,000 test with no reference price
[Fact] — The KOSPI's history at 7,000
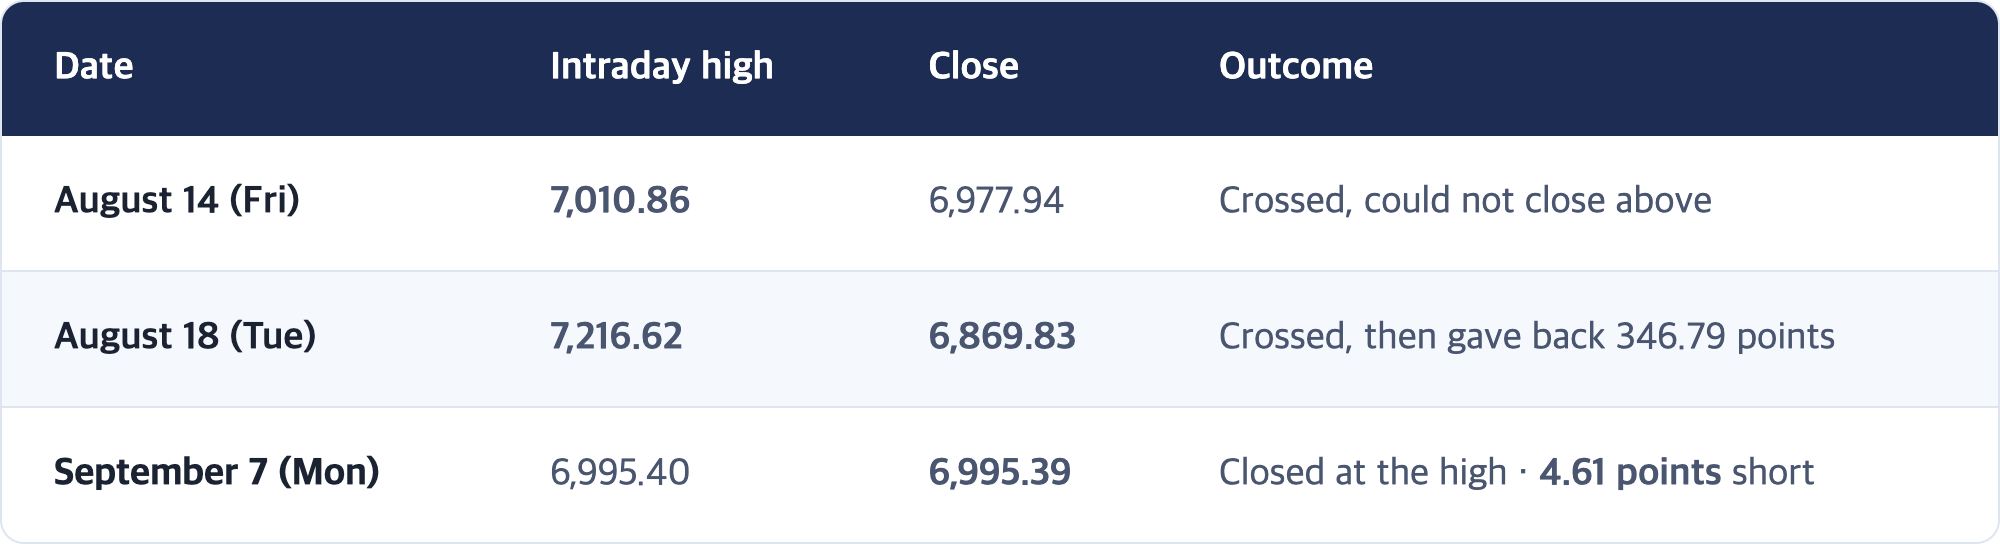
The three shapes are different. August 14 touched the line and stepped back. August 18 broke well through it and was sold hard. Yesterday never reached it, and closed at the session high.
[Interpretation] Why yesterday's shape is not like the other two
The August 18 failure happened after the break. Going from 7,216 down to 6,869 in one session means there were sellers stacked in that zone, and they appeared as soon as the index arrived.
Yesterday the index never got there. The high was 6,995.40 and the close was 6,995.39. It did not fade into the bell, and it has not yet touched the supply sitting above 7,000.
Reading that as bullish is half right. More precisely: yesterday was a day that did not take the test. The test starts today.
[Observation] What is stacked above 7,000
Korean brokerages publish estimates of this overhead supply, and the figures quoted in local media range widely — roughly ₩111 trillion to ₩174 trillion depending on the house and the method. This report does not adopt any single figure (see Correction 3).
The structure is clear without the number. Anyone who bought during the run to 7,216 on August 18 is underwater today. If the index climbs back into that zone, break-even selling appears. That is what was actually observed on August 18, and it is the structure today's session would meet on a break.
[Interpretation] But one input is missing today
A Korean trading day normally opens by reading what the US made overnight — the New York close, the semiconductor index, Treasury yields, the dollar. Those set the starting line.
Today those values do not exist. Both the US stock and bond markets were shut, and index futures stopped early at 13:00 ET. What Korea can reference this morning is Friday's New York close (Sept 4) plus Europe, oil and the currency from overnight. Nothing else.
What should you be careful about here? Whichever way the KOSPI moves today, that move contains less external input than usual. Domestic flows carry more of the weight. In other words, today's direction reflects the judgment of Korean participants rather than the judgment of the US market.
And the US market opens tonight at 22:30 KST and prices three days at once. Whatever the Korean session produces today is a price set before that calculation happens.
A suggested order of operations: treat today's Korean session as a test of domestic flows, and check the American answer separately tonight. Merge them into one reading and you will not be able to tell why the market moved during the day from why it moved overnight.
2. The Korea Variable (Sept 8, KST) — what kind of money arrived yesterday
[Fact] — Korean close, September 7 (Mon)
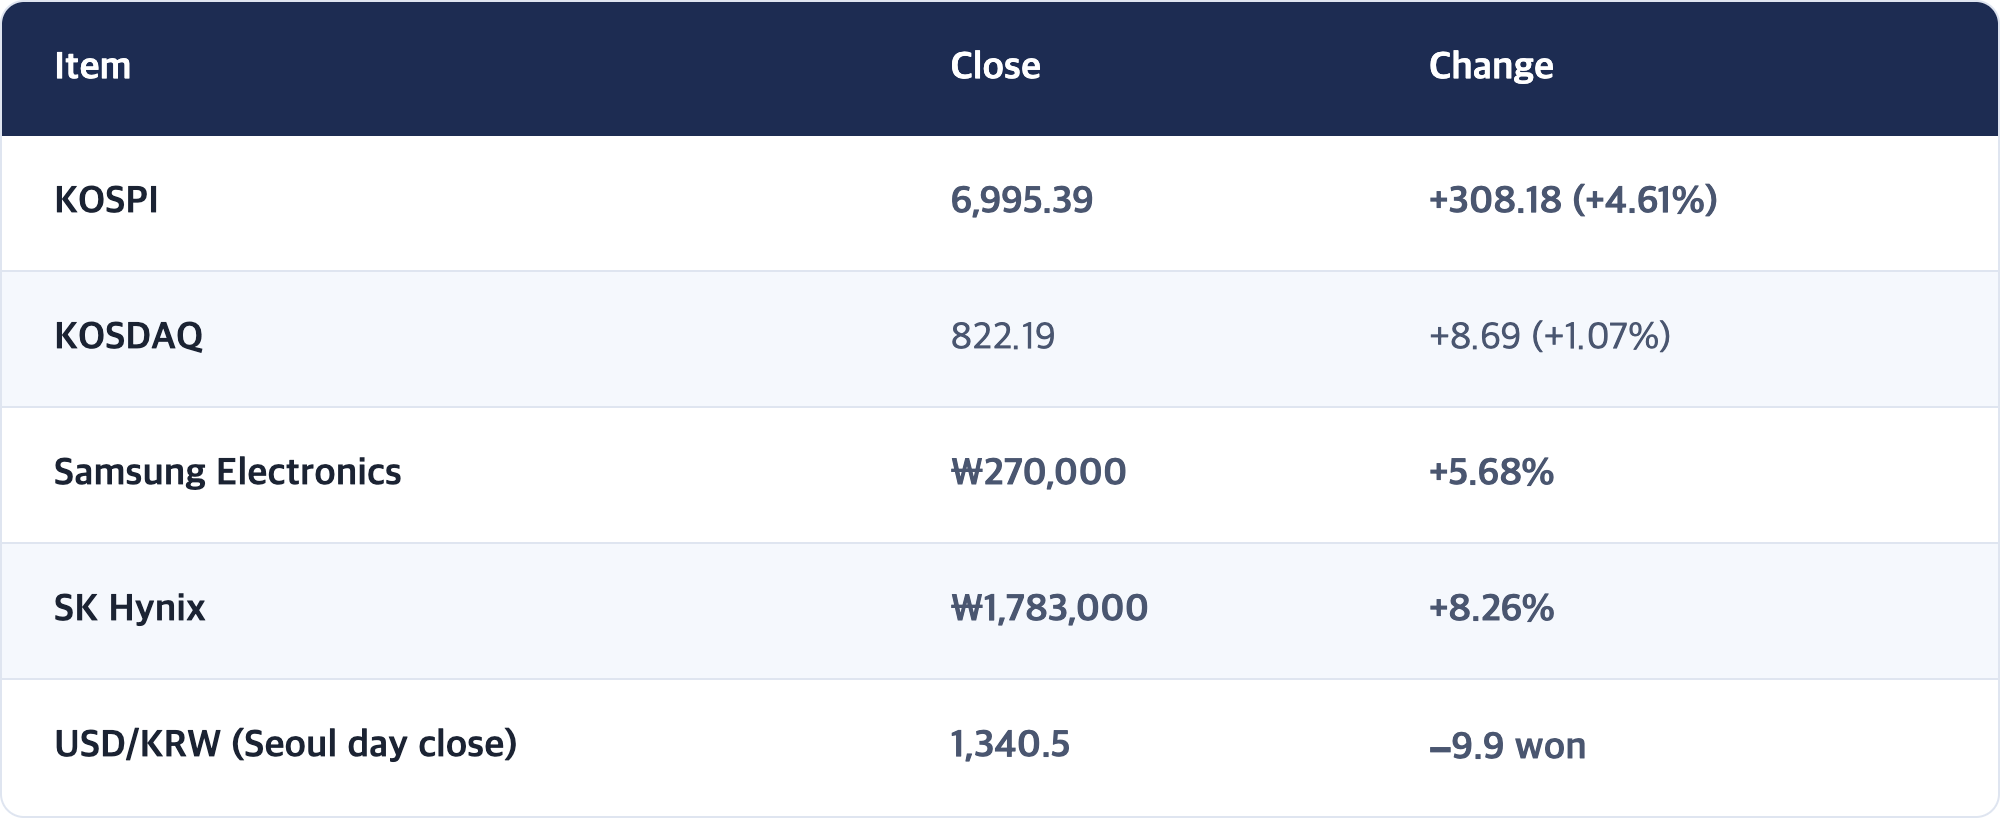
The index opened at 6,910.78 (+3.34%) and closed exactly at its intraday high of 6,995.40.
[Fact] — Flows (KOSPI)
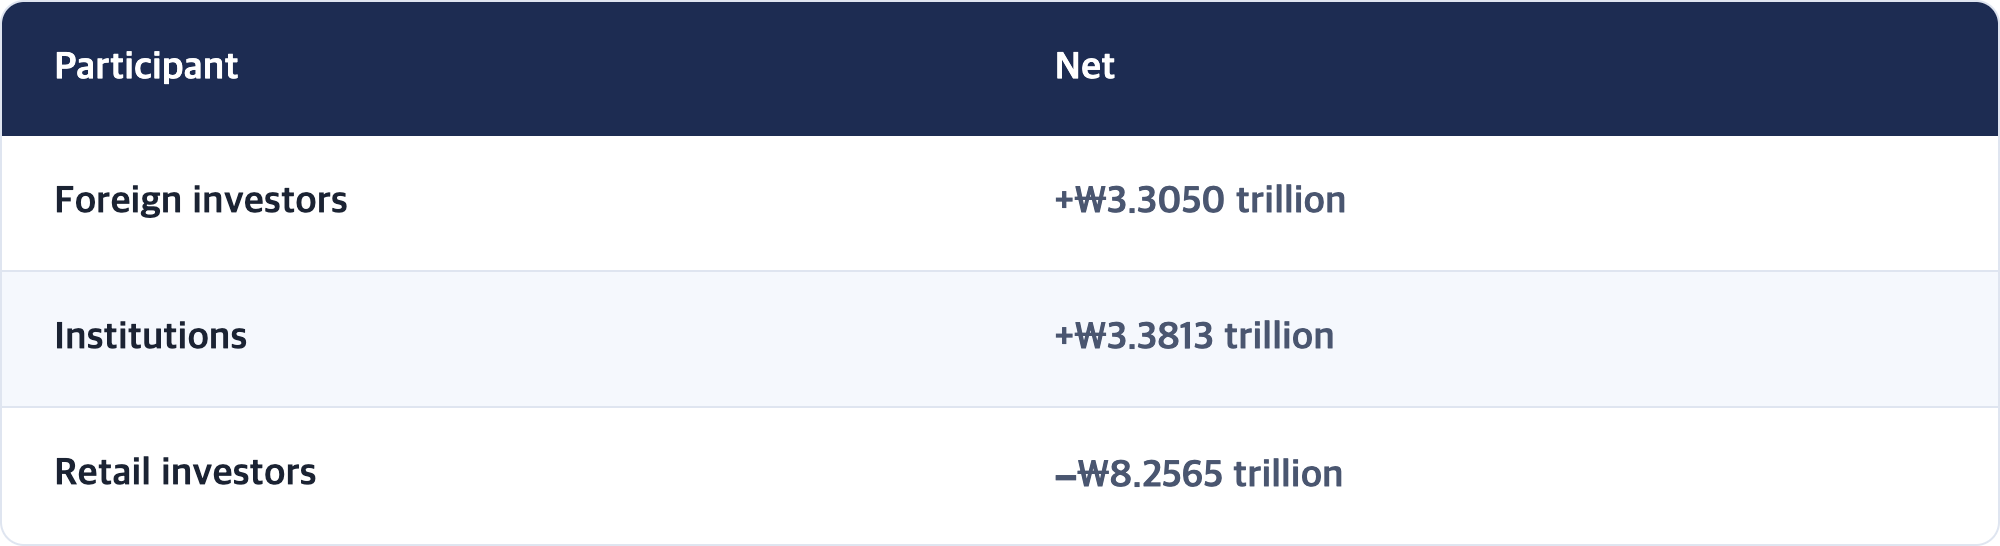
The KOSDAQ went the other way: retail +₩186.9 billion, foreign −₩67.5 billion, institutions −₩131.2 billion.
[Interpretation] The money came in, but what kind of money
Since late August this report has repeatedly recorded the same problem: nobody was buying except corporate treasury stock purchases. Yesterday foreign investors and institutions each stepped in with more than ₩3 trillion, and that vacancy was filled.
But note the shape. Two different participant groups moving the same way, on the same day, at more than ₩3 trillion each is usually index- or sector-level money rather than company-by-company conviction. Money that arrives together on one trigger leaves together when the trigger changes. Yesterday's trigger was Friday's US semiconductor surge — the SOX index rose 3.38% while the Nasdaq fell 0.29%.
Whether that trigger survives tonight's US reopening is this week's first checkpoint.
[Fact] — The won
USD/KRW closed at 1,340.5. It traded as low as 1,334.7 intraday, the strongest level for the won since October 2024. Yesterday's close is roughly a 23-month low for the dollar against the won.
[Interpretation] The source of won strength needs re-checking
The September 7 AM report attributed yesterday's won strength not to dollar weakness but to money coming in to buy Korean equities — the dollar index was 99.16, essentially unchanged.
Today that reading gets tested. If foreign buying fades and the won still holds the 1,340s, something else is at work. If foreign buying fades and the currency retreats with it, the reading was right.
One more thing worth noting. A stronger won during an oil rally is an unusual combination for Korea. Korea imports all of its crude, so higher oil shows up in the trade balance with a lag. It is safer to assume equity inflows are currently masking that pressure rather than that the pressure has gone away.
3. Macro Backdrop — for the first time, oil risk cuts both ways
[Fact] — Oil overnight
[Fact] — The Iran–Oman Hormuz agreement
Iran's foreign ministry spokesman, Esmail Baghaei, said an agreement with Oman on managing transit through the Strait of Hormuz is in its final stages and days away. It would cover a temporary safe route and be filed with the International Maritime Organization, the UN shipping body. The two governments have been negotiating for several weeks.
Bloomberg reported that oil reversed its gains on the news, with Brent slipping 0.1% to $96.15 after trading as high as $97.93 earlier. Other tallies for the same day show a close nearer $97–97.5 (see Correction 1).
[Interpretation] The number matters less than the fact that there are now two directions
From the weekend through yesterday morning, every oil headline pointed one way: Iran fired ballistic missiles at a US carrier, US Central Command struck three Iranian tankers, Iran signaled a restricted zone outside Hormuz. All supply disruption, and oil priced it.
Yesterday produced the first headline pointing the other way. If a transit agreement lands, more tankers pass through the strait.
There is a further layer. This is not a clean de-escalation story. As Bloomberg noted, an agreement could give Iran a say over which vessels transit the strait — something the US is unlikely to accept, having struck Iranian tankers only days ago.
So the picture now looks like this.
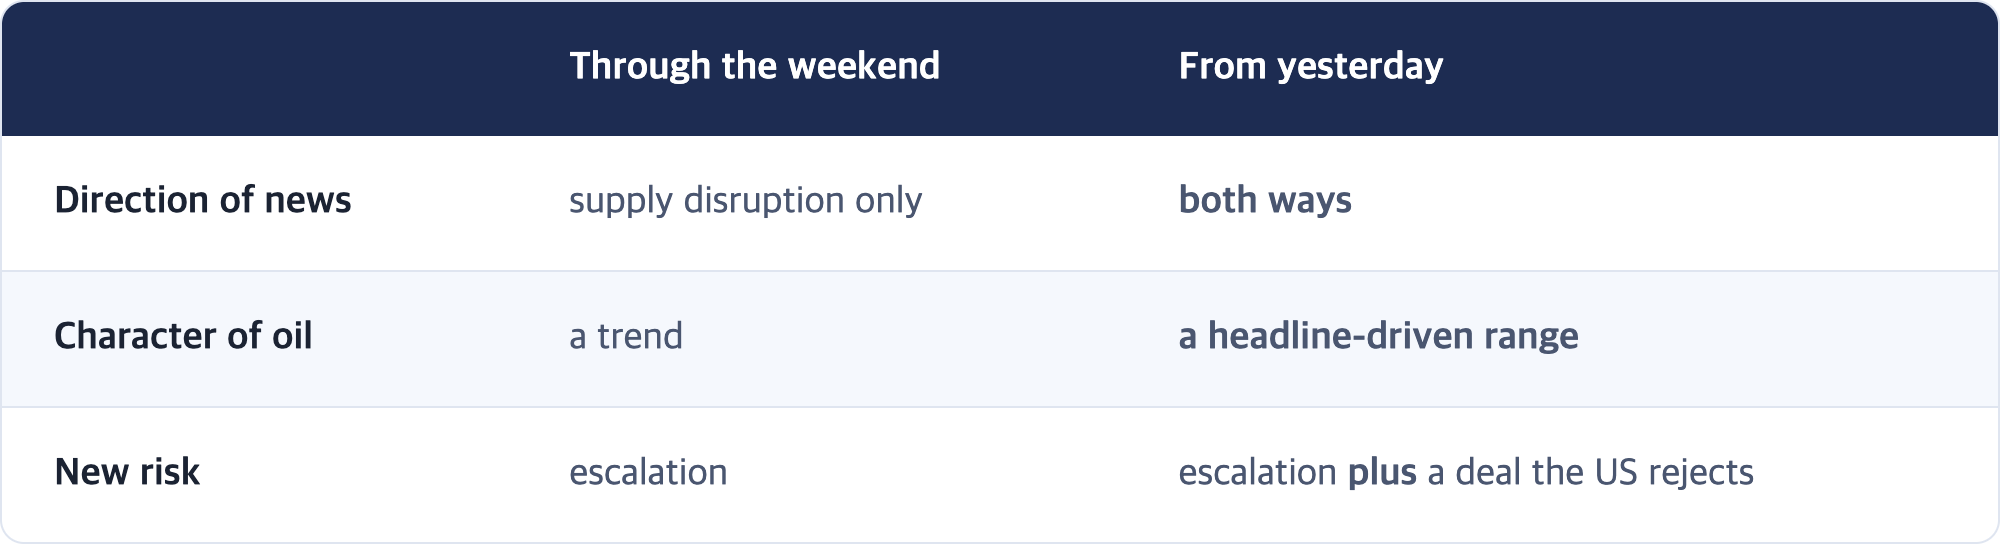
What changes for an investor: until last week you could reason from the premise that oil was rising. Now you are in a stretch where both directions can print inside the same day. For anything indexed to crude — energy, airlines, refiners, chemicals — look at the width of the range before the direction.
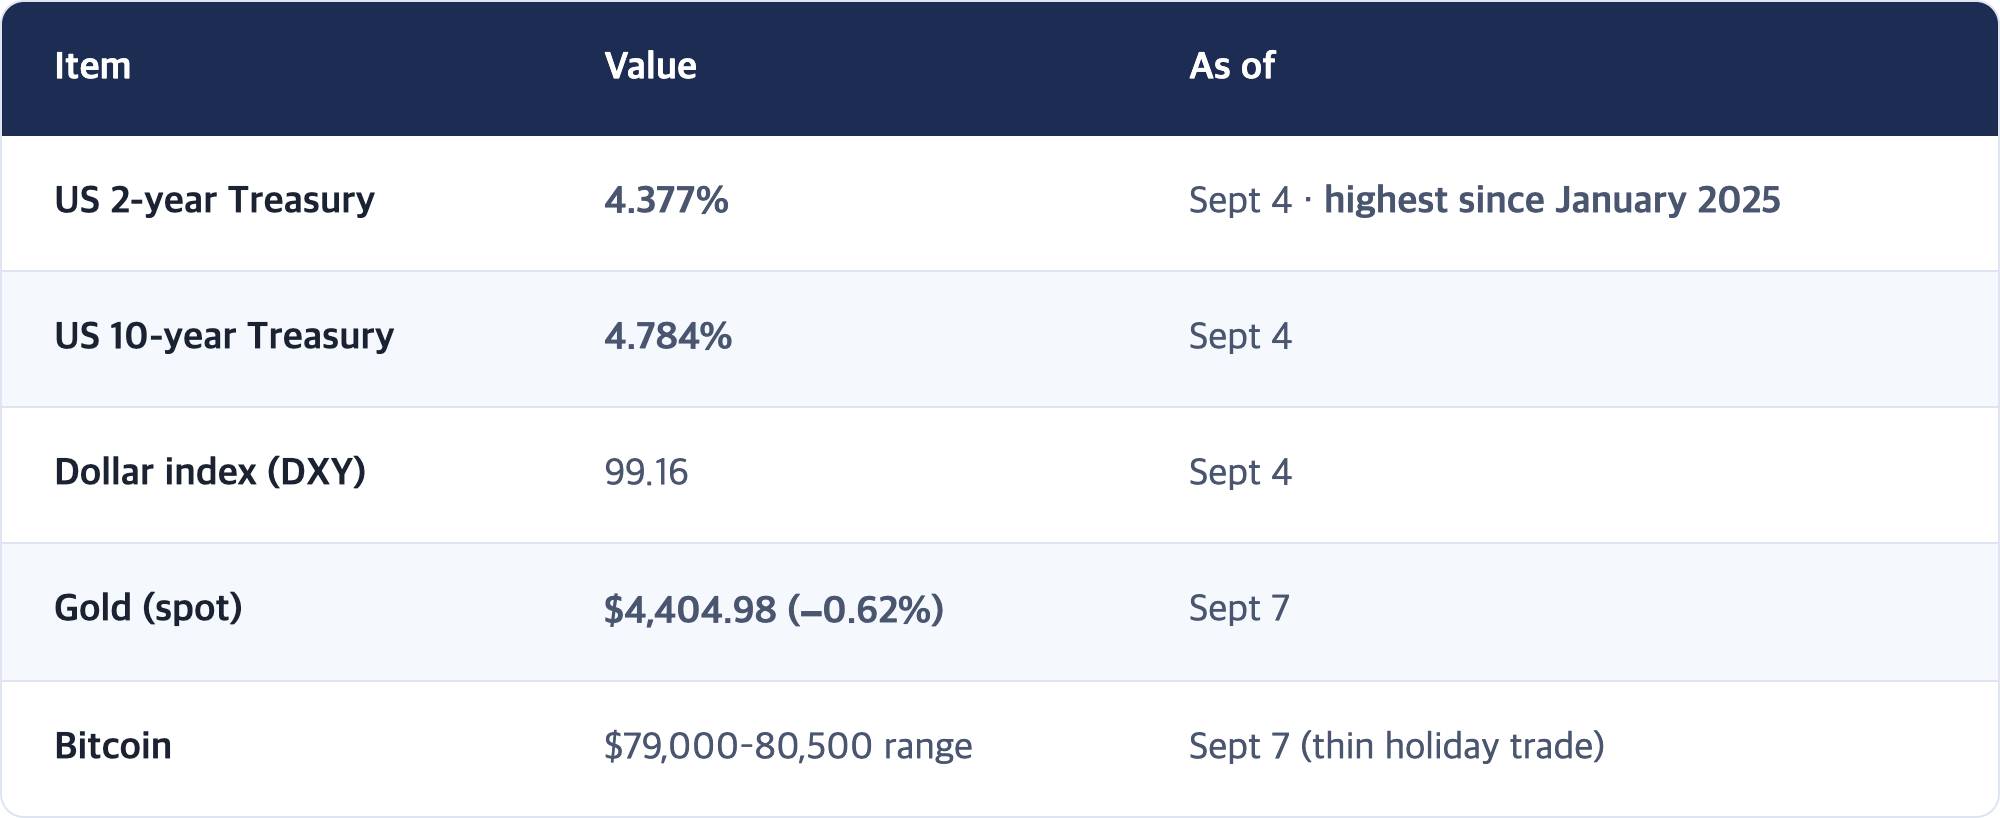
[Fact] — Rates, dollar and other assets (US bond market closed, so unchanged since Sept 4)
[Fact] — European close, September 7
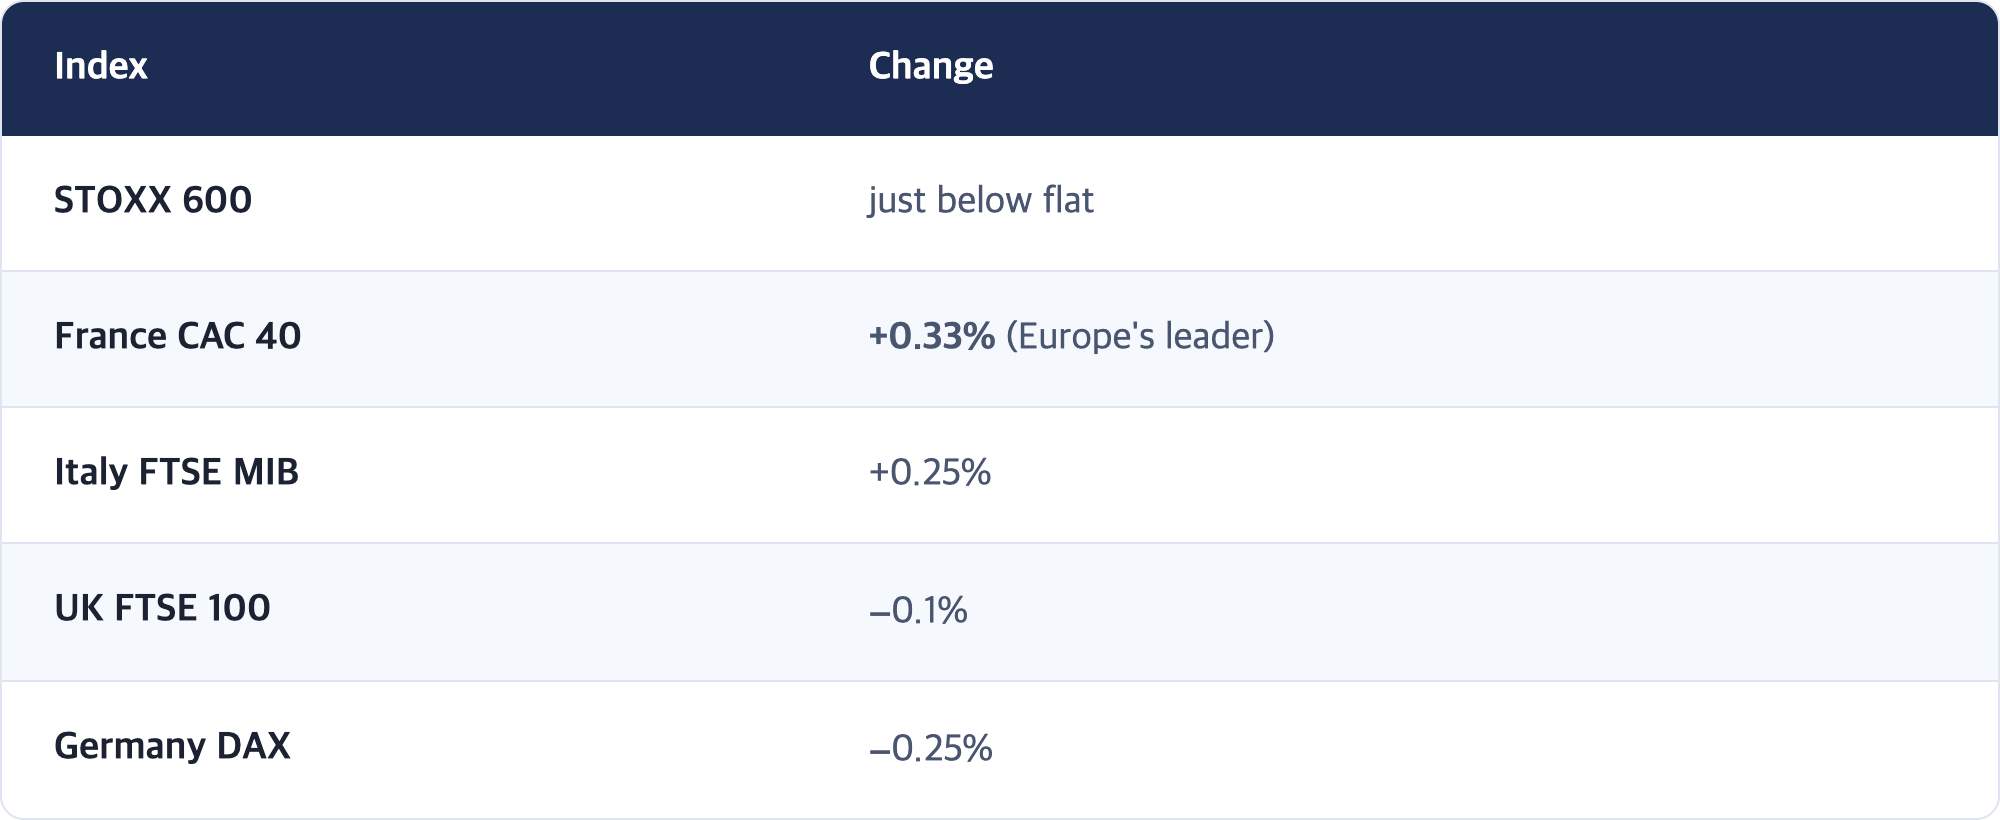
Sectors split. Oil and gas +1.29% and technology +1.1% led; healthcare −0.94% and financial services −0.91% lagged.
[Interpretation] What Europe's sector mix tells Korea
Europe bought energy and technology and sold financials. Weakness in banks could mean rate expectations wobbled — but with the US bond market closed there is no way to confirm that. It is a signal Europe produced on its own, so do not weight it heavily.
The one genuinely useful line for Korea is technology +1.1%. It says the warmth from Friday's US semiconductor surge carried into Europe, which is indirect evidence that yesterday's Korean chip strength has not yet been unwound. European tech and Korean memory are different animals, though, so use it as a reference and nothing more.
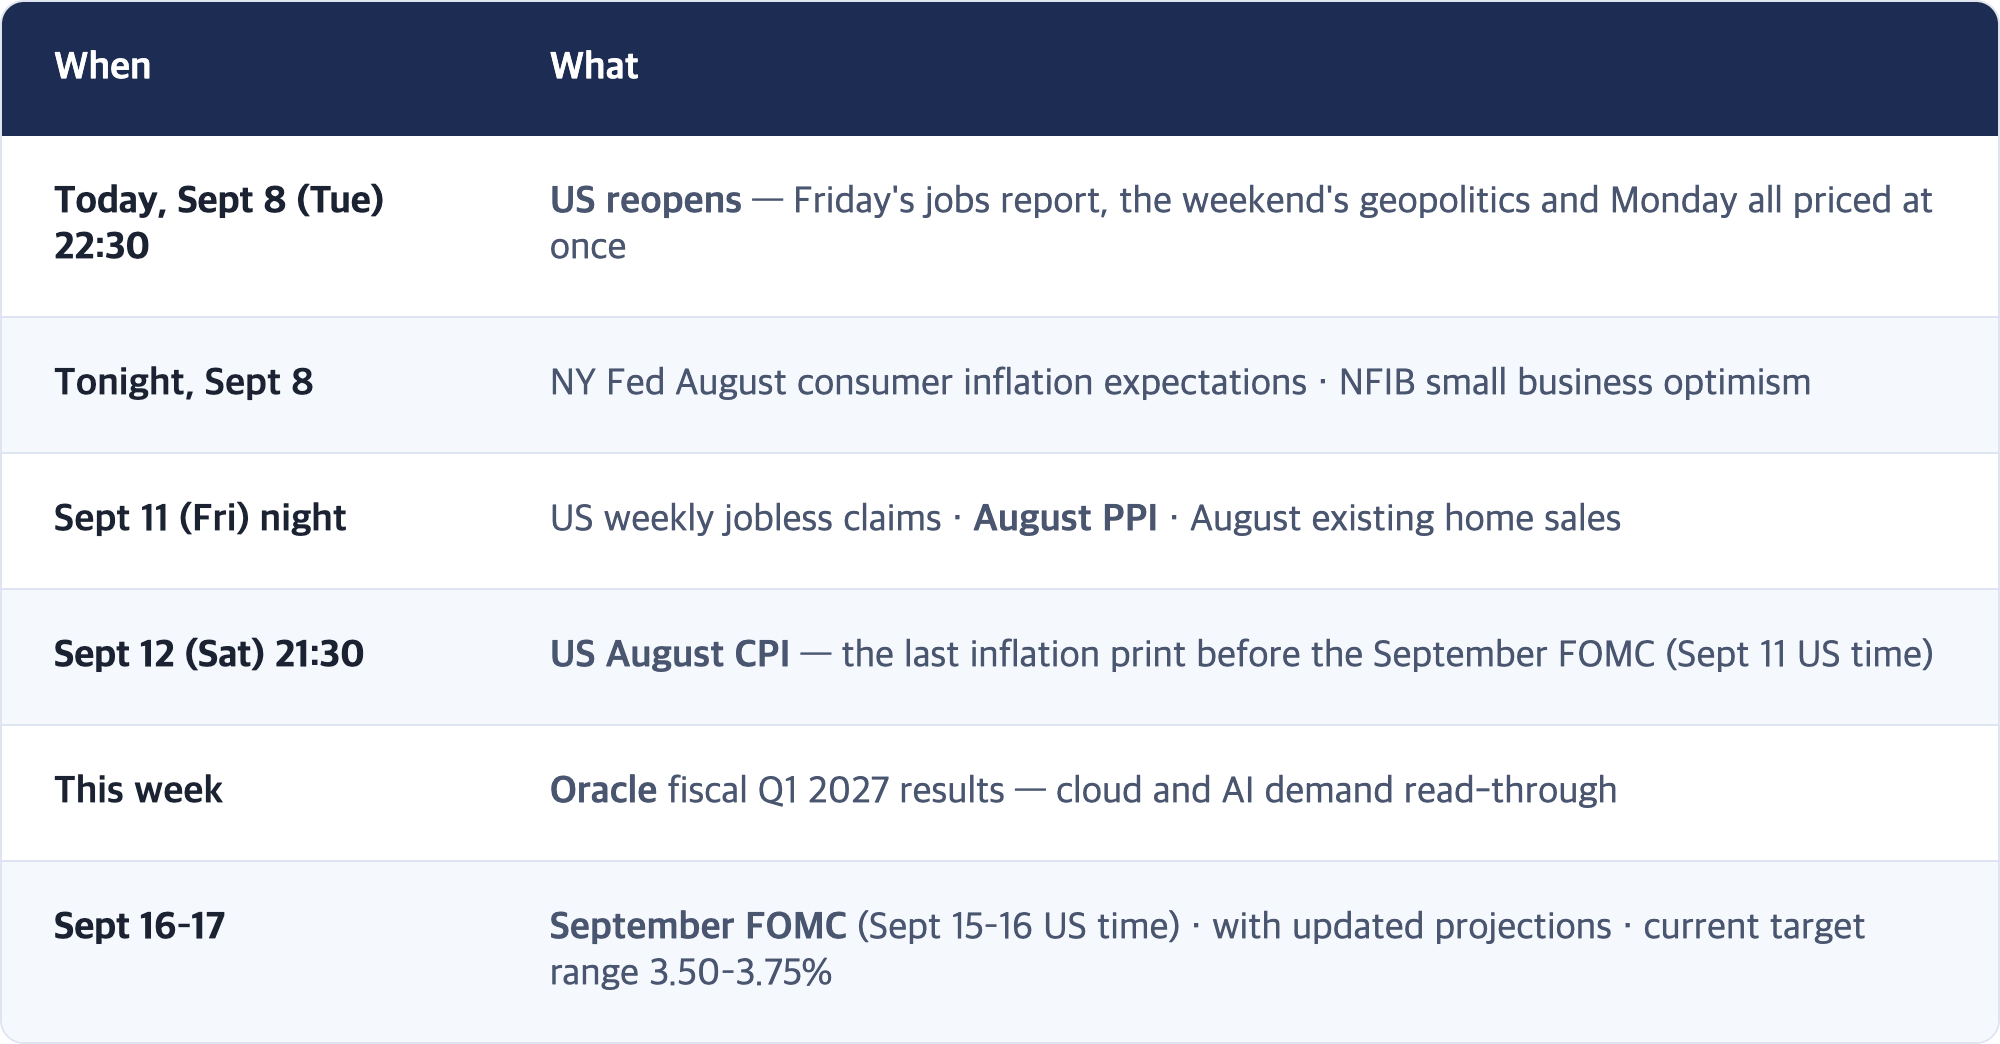
[Observation] — Event calendar (KST)
[Fact] — August CPI consensus (released Sept 11, US time)
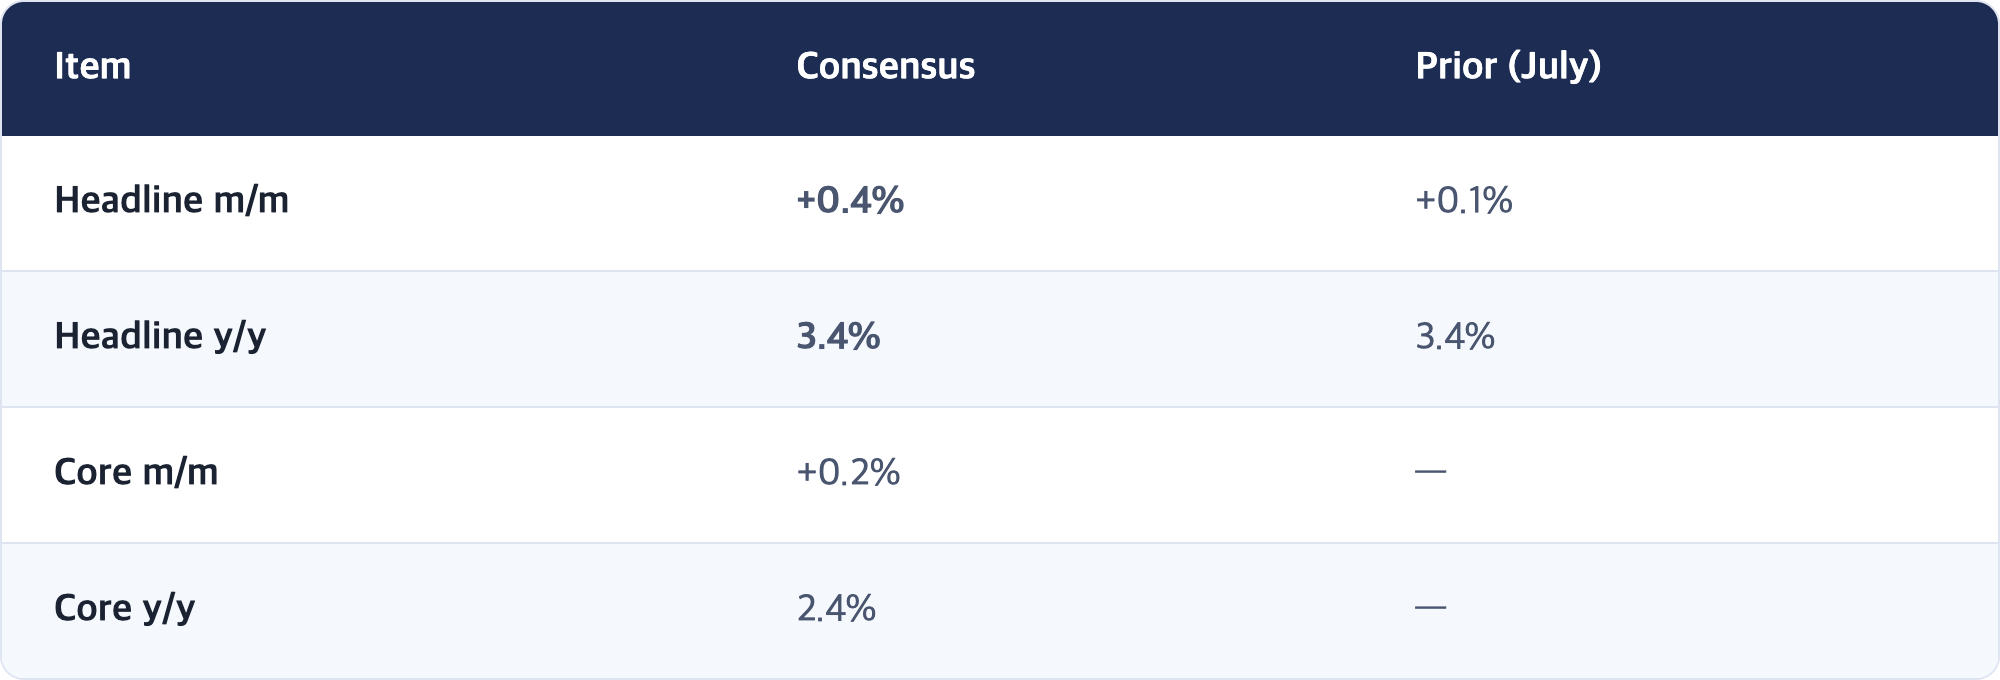
September hike odds differ by source: CME FedWatch around 60%, Polymarket 52% for a hike versus 49% for no change. Both firmed after August payrolls came in at +162,000, far above consensus. This CPI print effectively holds the decision.
4. Preview — the Korean session of Tuesday, September 8 (KST)
[Interpretation] — Four things. The axis comes first each time.
-
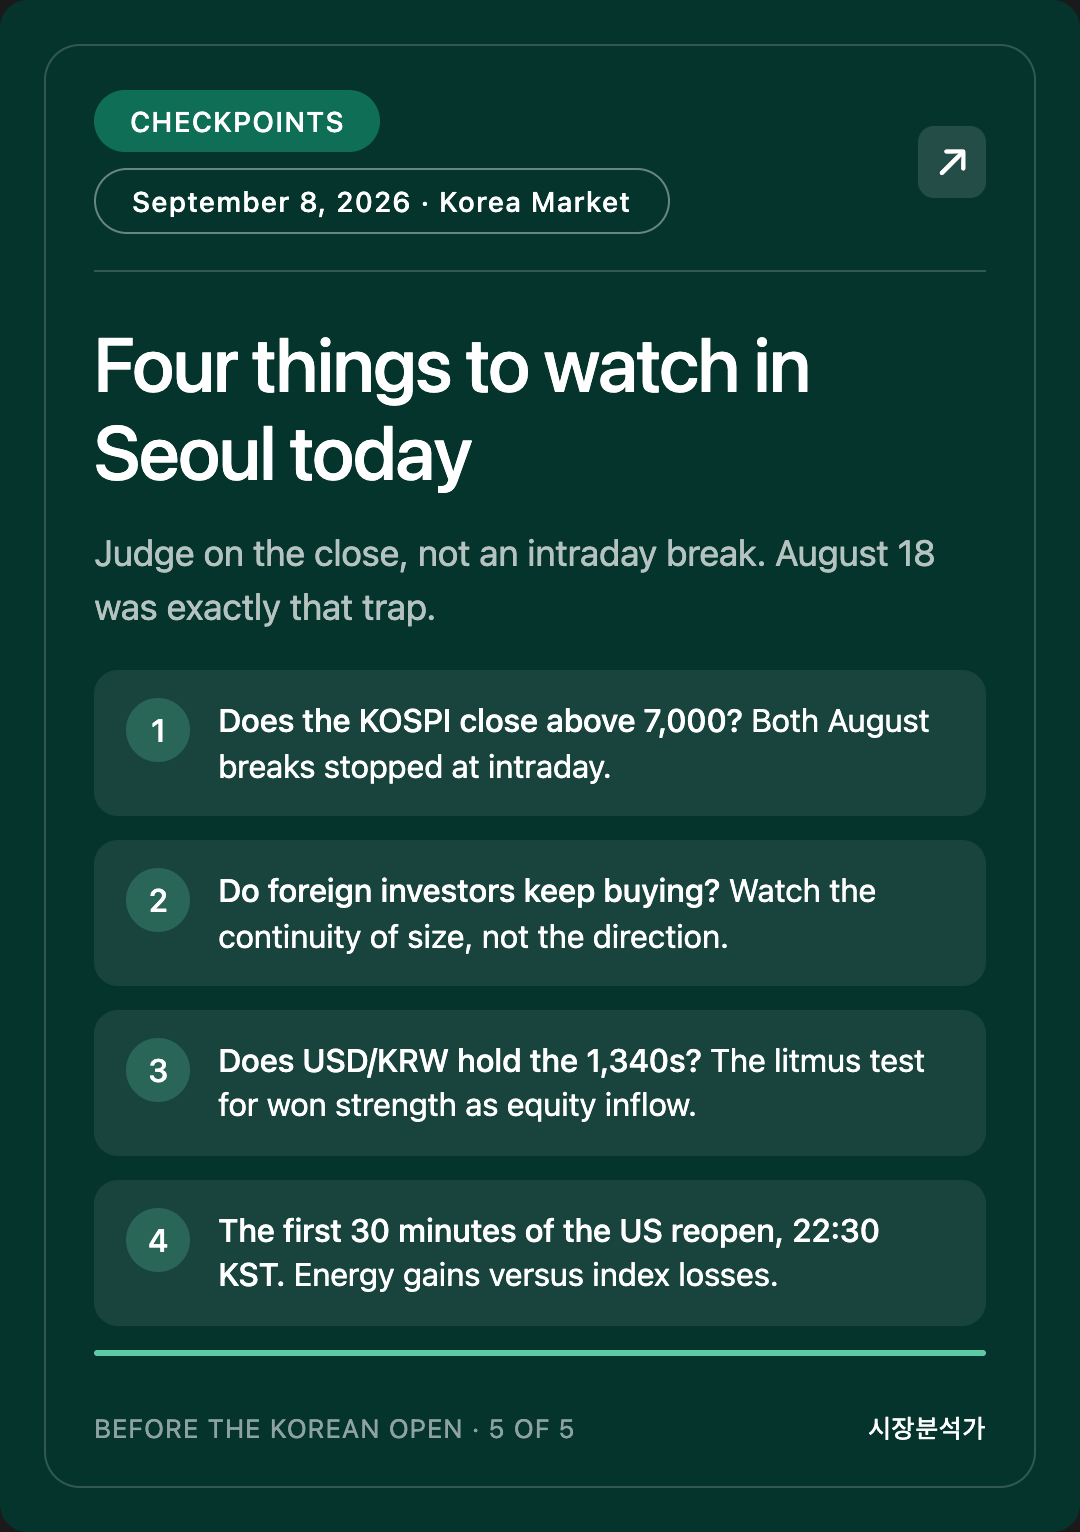
Does the KOSPI hold 7,000 on a closing basis?
Axis — was yesterday a return of buyers, or a one-day reaction?
Three stages: ① an intraday break above 7,000 ② a close above 7,000 ③ progress toward the August 18 high of 7,216. Both August attempts stopped at stage one. The close is the standard — do not read anything into an intraday break headline. August 18 was exactly that trap. -
Do foreign investors keep buying, and at what size?
Axis — was yesterday's ₩3.3 trillion index money or a genuine re-rating?
Watch continuity, not direction. Another trillion-won day points to re-rating; a tenth of yesterday's size says it was one-off money reacting to a single trigger. Also watch whether retail selling stays near yesterday's ₩8.26 trillion — sustained heavy retail selling would be evidence that the overhead supply above 7,000 is real and working. -
Does USD/KRW hold the 1,340s?
Axis — the litmus test for reading yesterday's won strength as equity inflows.
If foreign buying fades and the won holds, something else is driving it. If foreign buying fades and the rate slides back toward 1,350, the September 7 AM report's reading was correct. Either way, you get the answer within today. -
In the first 30 minutes of the US reopening tonight at 22:30, the ratio between energy stocks and the index.
Axis — is geopolitical risk a price or a backdrop?
The US has not yet priced the Iran escalation even once. If energy rises and the index holds, the market is treating it as a sector story. If the index falls with it, it has been promoted to a macro risk. The Oman headline now sits on top of this, so leave open the possibility that energy stocks fall instead.
[Interpretation] The week's structure for a Korean investor
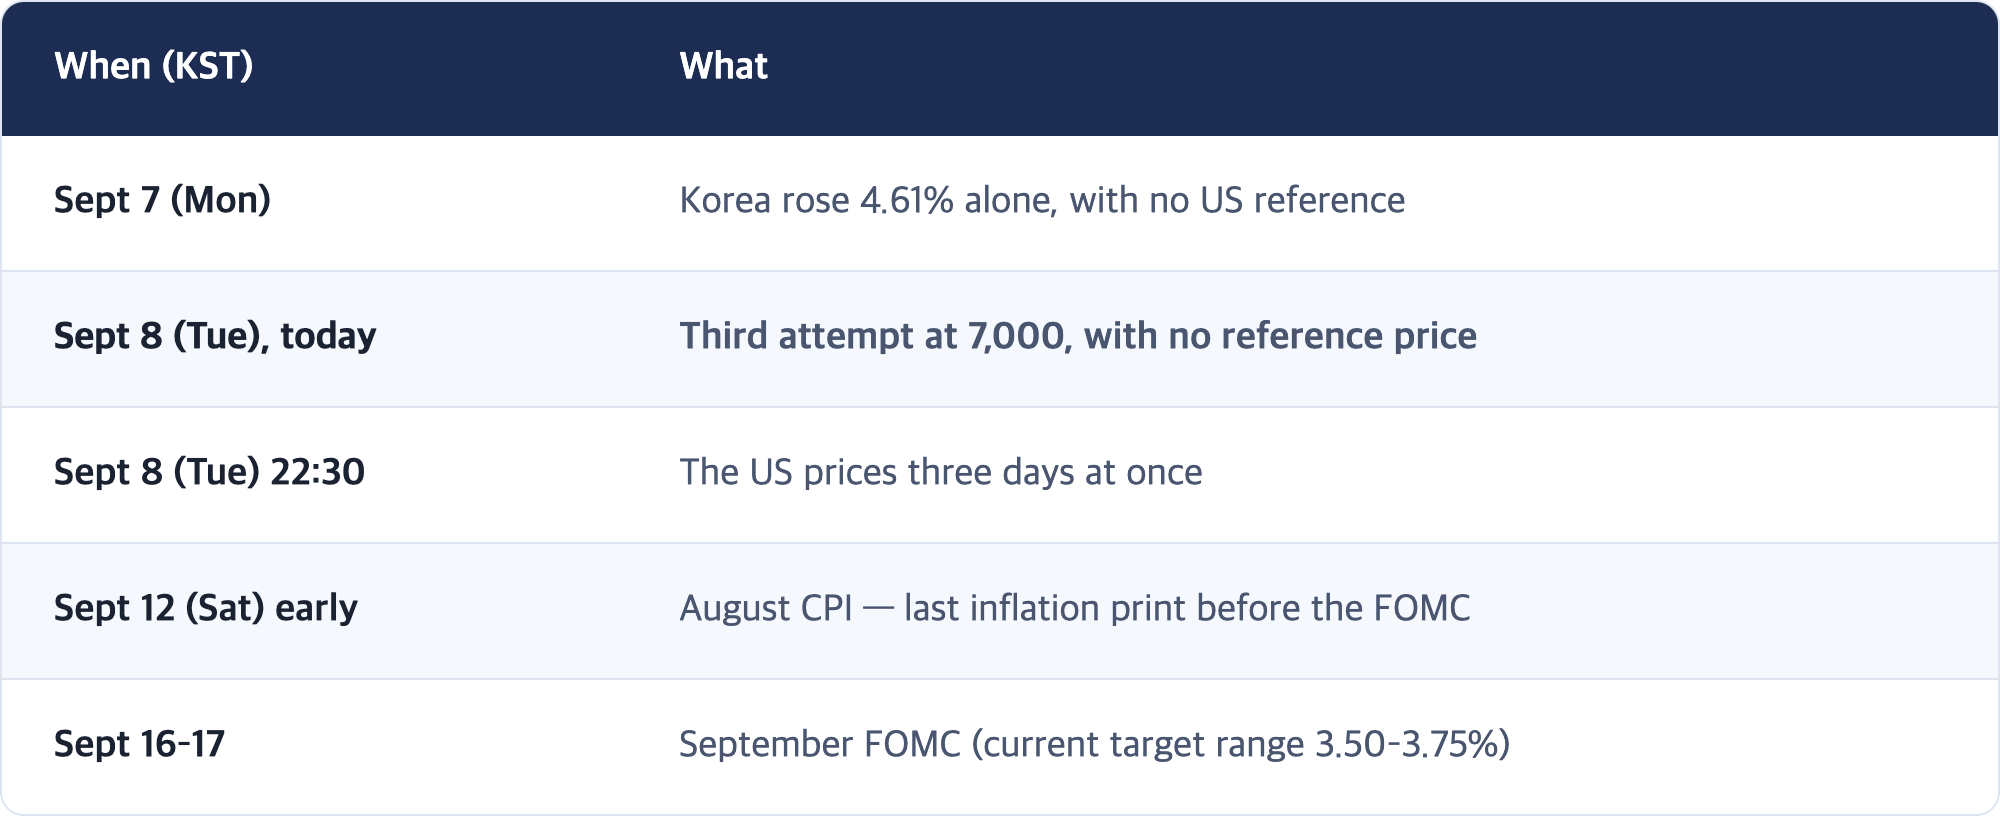
This week Korea moves first and America grades afterward. That was true yesterday and it is true today. The order flips tonight.
Do not read this as a directional call. It describes where the information is concentrated, not whether the market goes up or down today.
📖 Study Note — overhead supply, and why an index stalls twice in the same place
The concept. Sometimes a stock or an index has unusual trouble getting through a particular price zone. That zone is called overhead supply — sellers stacked above the current price.
The mechanism is simple. If many people bought in that price range in the past, many people are ready to sell when the index returns to it. Why sell? Because someone who has been sitting on a loss and finally gets back to break-even usually wants out.
An analogy. Picture a rest stop on a hiking trail. If a lot of people once climbed to that rest stop, ran out of energy and turned back, then the next time a group reaches it, a lot of them stop there again. Not because the mountain got steeper, but because that spot accumulated memories.
The live example is happening right now.
Why August 18 matters. People bought on the way from 7,000 to 7,216 that day, and the index fell to 6,869 before the session ended. Those buyers are underwater today. If the index moves above 7,000 and back into that band, break-even gets close for them.
How to use this. Three habits are enough.
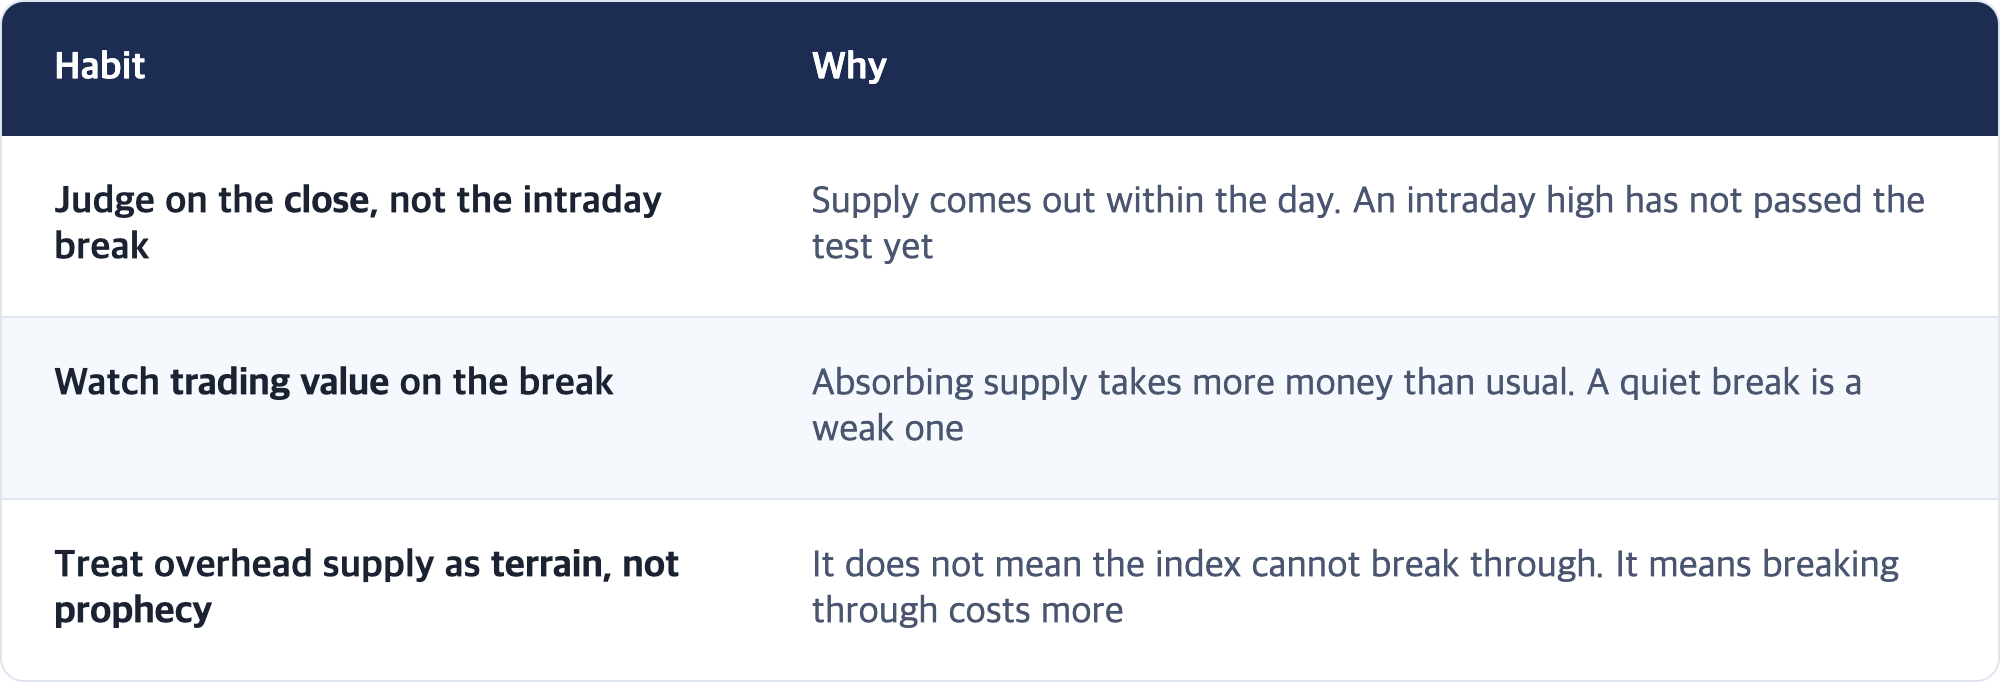
One caution. Every house calculates overhead supply differently. In this report the estimates quoted in Korean media ranged from ₩111 trillion to ₩174 trillion, which is why no single figure was adopted. Take the structure, not the number.
📌 Corrections and Follow-ups
1) Sources disagree on Brent's overnight close. Bloomberg reported a reversal to $96.15 (−0.1%) on the Oman headline; other tallies show a close of $97–97.5, a six-week high. The gap is about 1.4%, so the body quotes a range around $97 and states the reversal separately. A confirmed settle will be sourced next session.
2) The September 7 AM report's oil framing is partly adjusted. That report summarized the weekend in one direction — oil was the thing that grew. The facts were right, but the Oman headline that afternoon introduced a counter-direction. Describing this as a two-way stretch rather than a trend is more accurate now. Reflected in section 3.
3) No overhead-supply figure was adopted. Korean media quote roughly ₩111.5 trillion (Kiwoom) and ₩173.9 trillion (iM Securities). One published breakdown also allocates retail buying to index bands of 8,000–9,000, levels the KOSPI has never actually reached, so it was not cited. This report uses only the recorded prices of August 14 and August 18.
4) A quoted 12-month forward P/E of 5.5x for the KOSPI was not adopted. One outlet cited it as evidence of historically low valuation, but it sits far from typical KOSPI forward multiples and was not used without verification.
5) Two unresolved items from the September 7 AM report. ① The SOX index level (points) for September 4 was again not sourced; only the +3.38% change is confirmed. ② Hang Seng and Shanghai closes for September 7 — the Shanghai Composite was not sourced, while CSI 300 +0.59% was confirmed. Only verified values appear in the body.
6) The estimated corporate-treasury (other corporations) net buy for September 7 was not re-verified. The September 7 AM report derived roughly ₩1.57 trillion arithmetically. It remains an estimate rather than a sourced figure, and it is not used in this report's interpretation.
7) The September hike probability still differs by source. CME FedWatch is around 60% while Polymarket shows 52% for a hike and 49% for no change. The September 7 AM report wrote in the 50s; the change since then is CME moving up to 60% after the jobs report. Both figures are shown side by side in the body.
8) This edition ran on schedule. Scheduled 16:00 PDT, actual start 16:03 PDT. No drift.
9) The September 6 (Sun) PM edition did not run. No report exists for the Vancouver 16:00 slot that day. The cause is unidentified; it may be the structural weakness recorded in CONTEXT.md, where a closed Cowork app causes a scheduled run to be skipped. Noted for the record only.
🔗 Sources
- European stocks close mixed and Asia-Pacific markets rise as investors assess renewed Middle East hostilities — CNBC
- European Stocks Muted as Oil Prices Climb and Novartis Falls — Bloomberg
- Iran Says Strait of Hormuz Deal With Oman Just Days Away — Bloomberg
- Oil Extends Gain as Iran Says Hormuz Deal With Oman Days Away — Bloomberg
- Brent Nears $98, WTI Tops $92 as Hormuz Strikes Return — Vantage Markets
- Oil Near Six-Week Highs as U.S.-Iran Tanker Strikes Intensify Hormuz Supply Risk — EnergyNow
- Iran, Oman, US 'close' to Hormuz deal: What do they all want? — Al Jazeera
- Nikkei 225 Climbs 2% on AI Chips, but 883 Tokyo Stocks Fell as 630 Rose — TechTimes
- KOSPI closes just below 7,000 after a 4.61% surge — Businesskorea
- Twice above 7,000 and unable to hold it — will September stick? — Etoday
- The 7,000 wall, blocked for a month and a half — Etoday
- Over 100 trillion won of retail overhead supply above 7,000 — Asiae
- New York weekly preview: CPI as the pivot for the September hike debate — Nate
- Jobs report August 2026 — CNBC
- What a Blowout August Jobs Report Means for a September Rate Hike — Kiplinger
- Fed Decision in September? Trading Odds & Predictions 2026 — Polymarket
- US Labor Day Holiday Trading Schedule (2026) — AMP Futures
- Is the Stock Market Open on Labor Day 2026? CME Futures Hours — Finance Calendar
- Gold — Trading Economics
- Bitcoin News Digest September 7, 2026 — Mike Richardson
📌 More market briefs
※ This post is market observation and organization intended to support your own judgment. It is not a recommendation to buy or sell any security. Figures are as of the time of writing and may differ between sources.
If this was useful, bookmark it or pass it along. It genuinely helps me write the next one.
I can survive. We can survive.