September 10, 2026 US Market Brief — Nasdaq and S&P 500 Before the Open
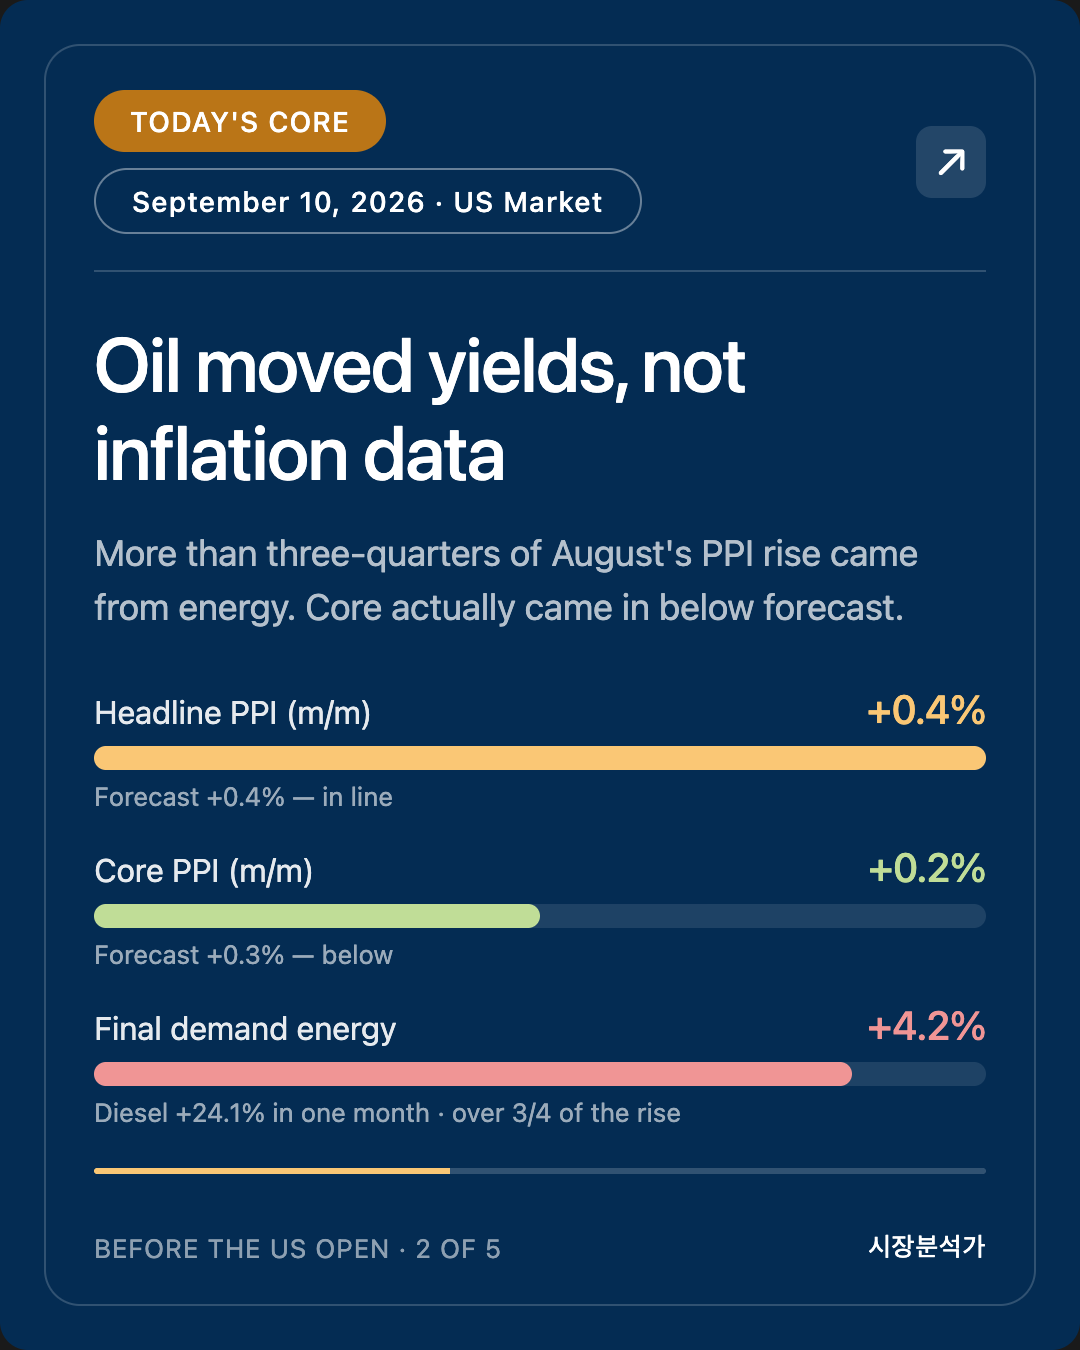
- US August PPI — headline +0.4% (in line), core +0.2% (below the +0.3% forecast). Year-on-year: headline 5.4%, core 4.6–4.7%. More than three-quarters of the rise came from energy (+4.2%), and diesel jumped 24.1% in a single month. The source of the inflation is confirmed in the data: it is oil.
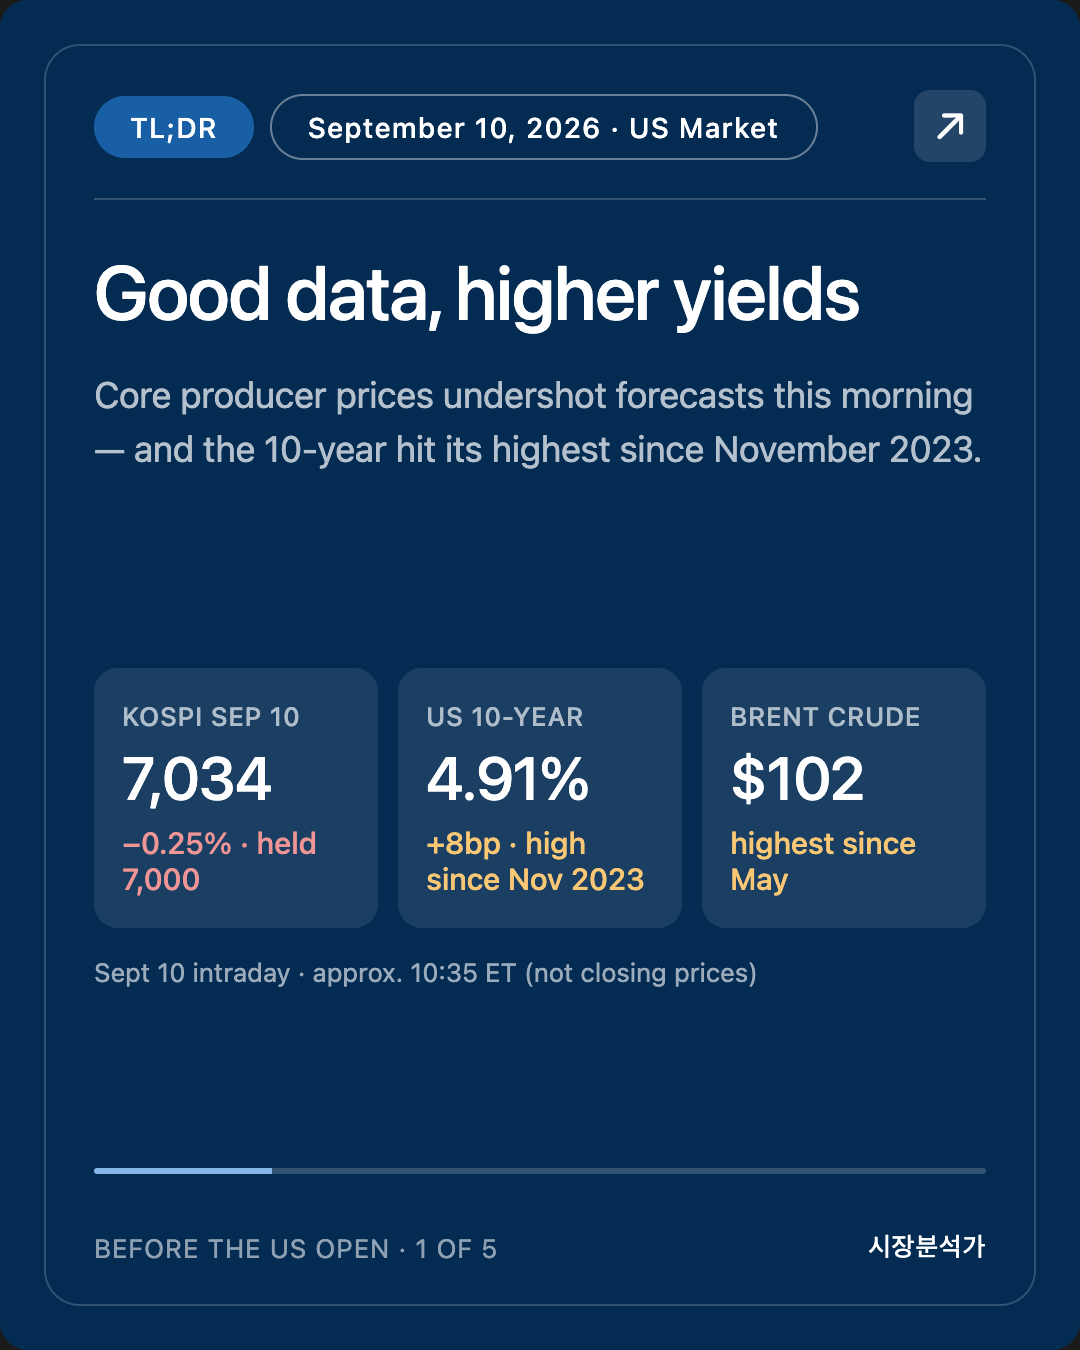
- Yet the 10-year yield pushed to 4.91% (+8bp), a fresh high since November 2023. That clears the 4.85% line this report drew yesterday and sits just under the five-year peak of 4.92%. Yields rose on a day when core inflation came in cooler than expected — that is the single most important thing today.
- The driver is not the data. It is the oil price itself. WTI cleared $100 and Brent $102, both the highest since May, as the Strait of Hormuz confrontation escalated — Iran struck US Navy vessels, and the US destroyed five Iranian tankers.
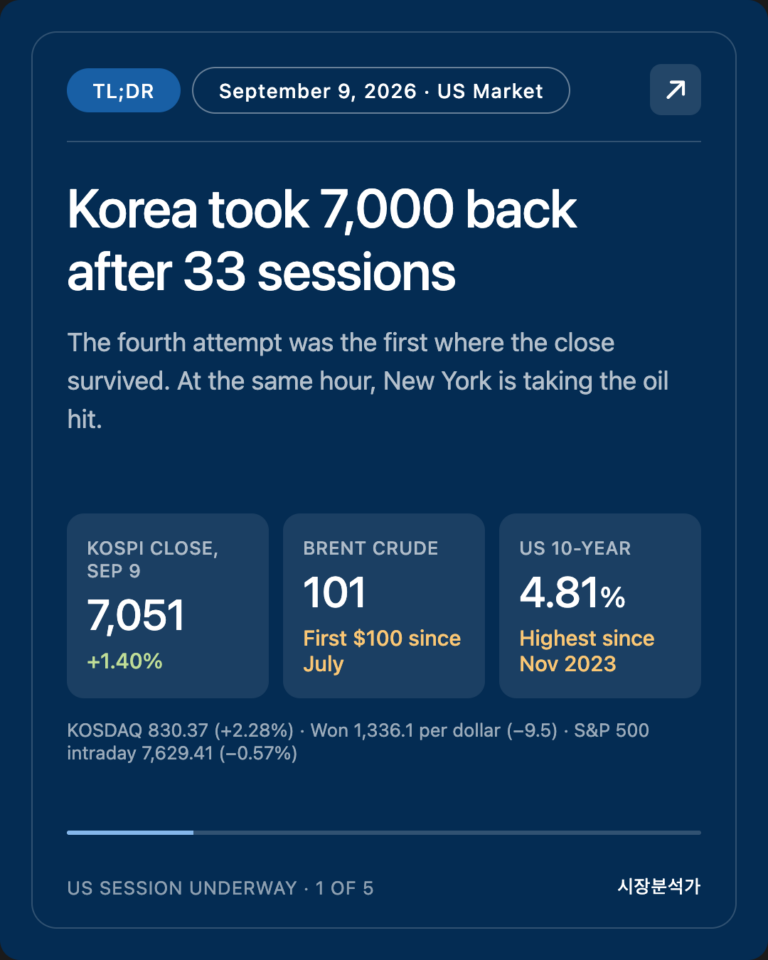
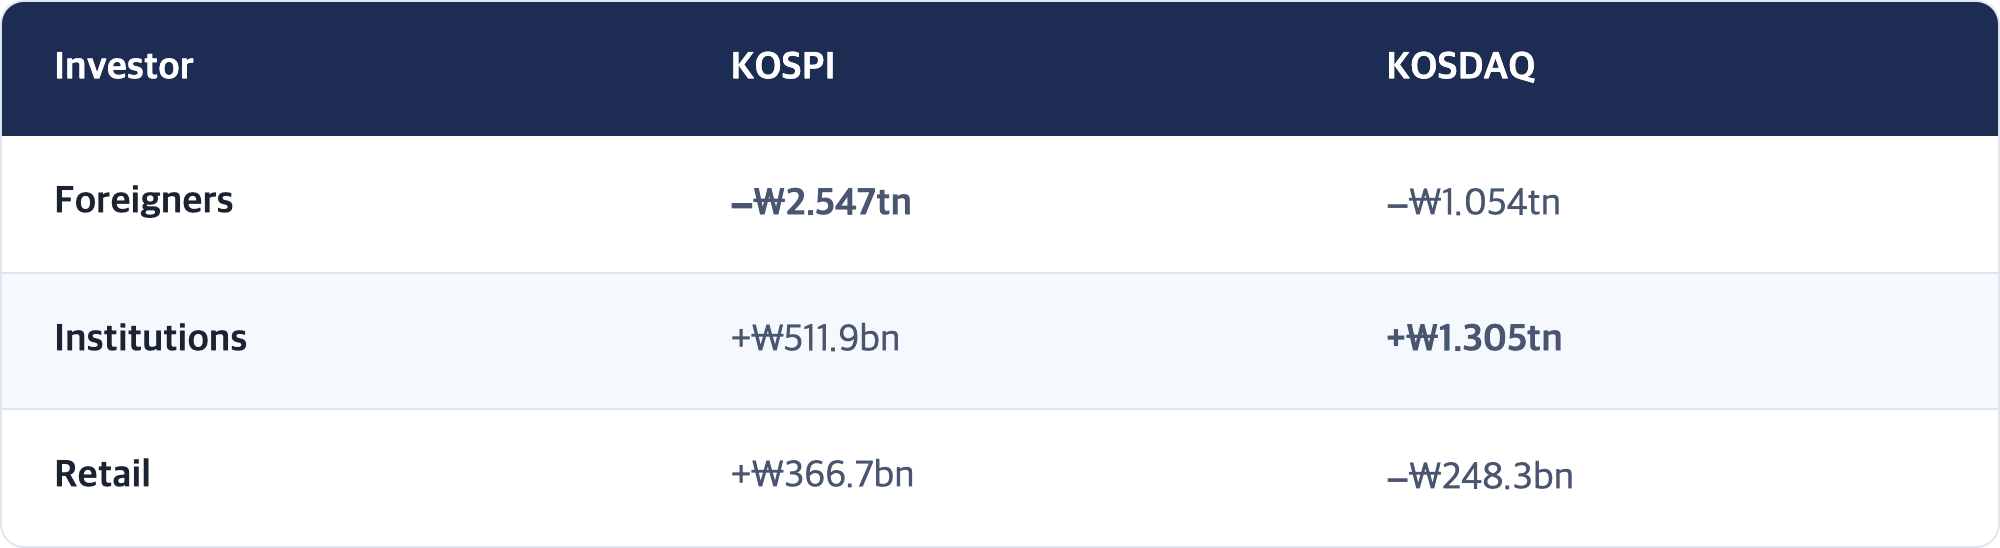
- Korea's KOSPI held 7,000 — closing at 7,033.92 (−0.25%). It passed the fourth test this report set yesterday. But the mechanics changed completely: foreigners sold ₩2.55 trillion and domestic institutions and retail absorbed it. The KOSDAQ actually rose, to 836.92 (+0.79%).
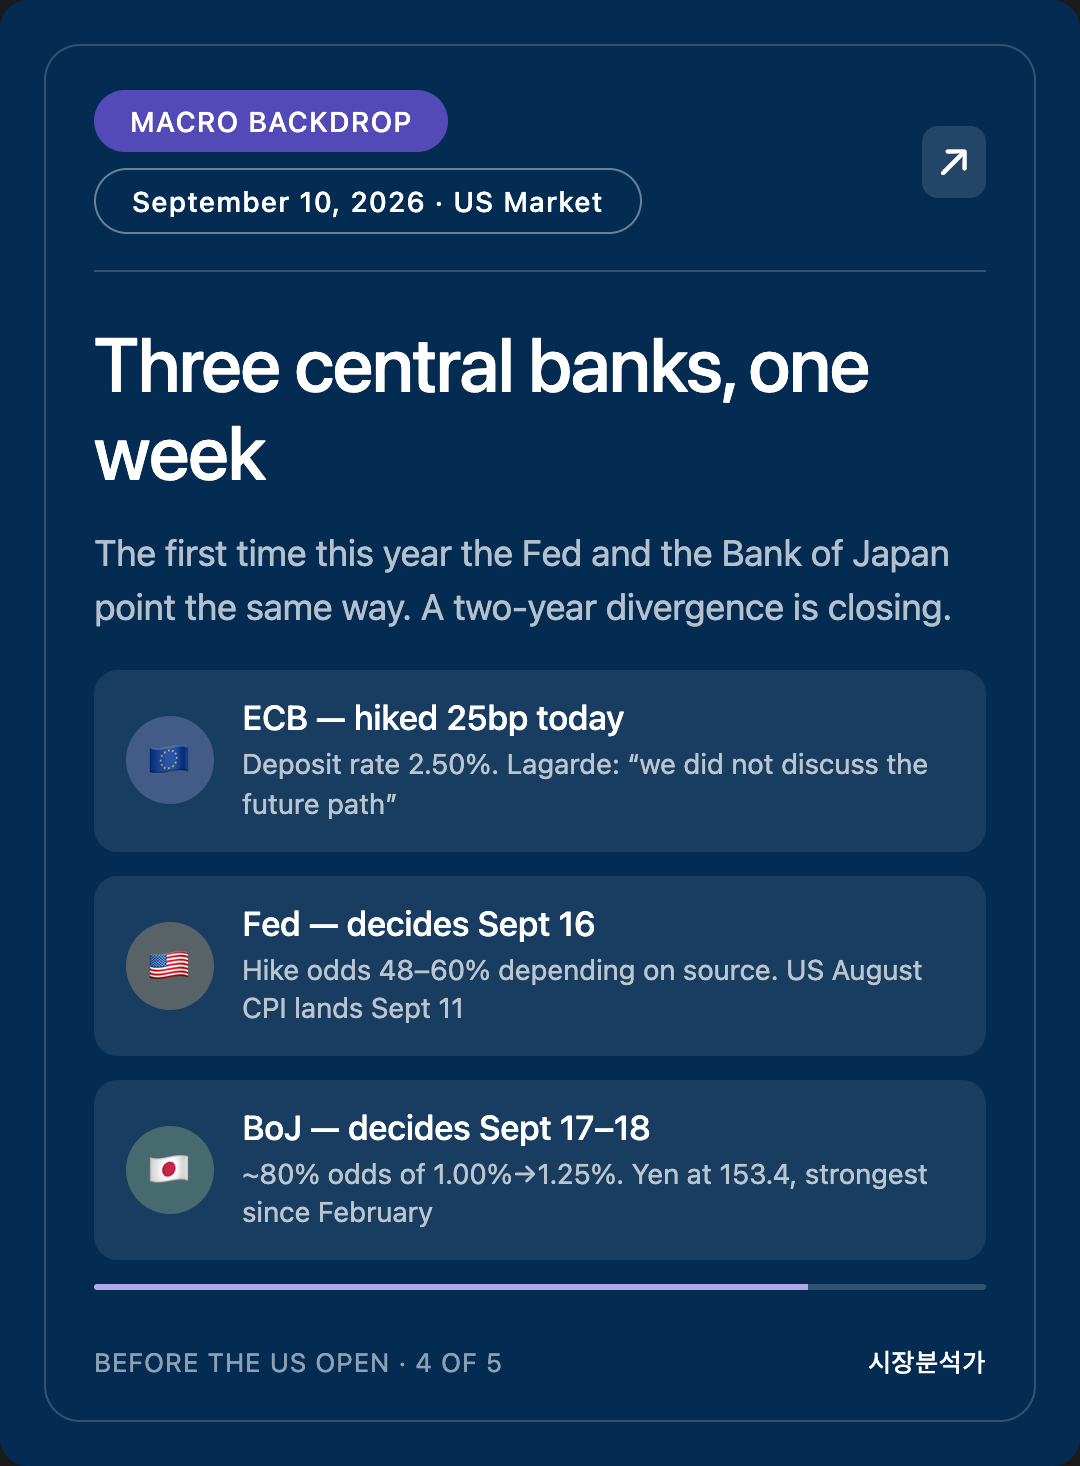
- The ECB raised rates 25bp today, taking the deposit rate to 2.50%. The Fed decides Sept 16 and the Bank of Japan Sept 17–18. This is the first week this year that all three major central banks are looking the same direction.
This is Mr. Can. Here is the September 10, 2026 brief ahead of the US market open.
Written: 2026-09-10, 07:35 PDT (Seoul: Sept 10, 23:35 KST)
Covers: Korea/Asia Sept 10 close + Europe Sept 10 morning + US Sept 10 intraday (approx. 10:35 ET)
⚠️ This edition ran 1 hour 39 minutes late — scheduled for 05:30 PDT (08:30 ET, one hour before the open), started at 07:09 PDT (10:09 ET). New York had already been open about 40 minutes.
This is the second consecutive late AM run. Yesterday it was 3 hours 55 minutes; today 1 hour 39. Once is an accident; twice is a pattern. It is logged under Corrections below.
The US figures here are live intraday prints, not pre-market estimates — and not closing prices. Final closes will be reconciled in tonight's Before the Korean Open edition.
One thing worked in our favour. US August PPI landed at 08:30 ET this morning, and because we ran late we can report the number and the market's reaction to it together. That is exactly where today's story sits.
SEO Intro
US producer prices for August came out this morning. Headline PPI rose 0.4% month-on-month, matching expectations. Core rose 0.2%, below the 0.3% forecast.
Yesterday this report drew a table. "If headline rises and core stays quiet, the Fed gets room to call it a temporary supply shock." Today's PPI landed precisely on that line.
Thirty minutes after the release, the US 10-year Treasury yield rose to 4.91% — up 8 basis points, the highest since November 2023. Stocks fell for a fourth straight day.
The data handed the Fed room, and the market declined to use it. Why that happened is today's story.
1. Today's Core — Good Inflation Data, Higher Yields
[Fact] US August Producer Price Index (released Sept 10, 08:30 ET)
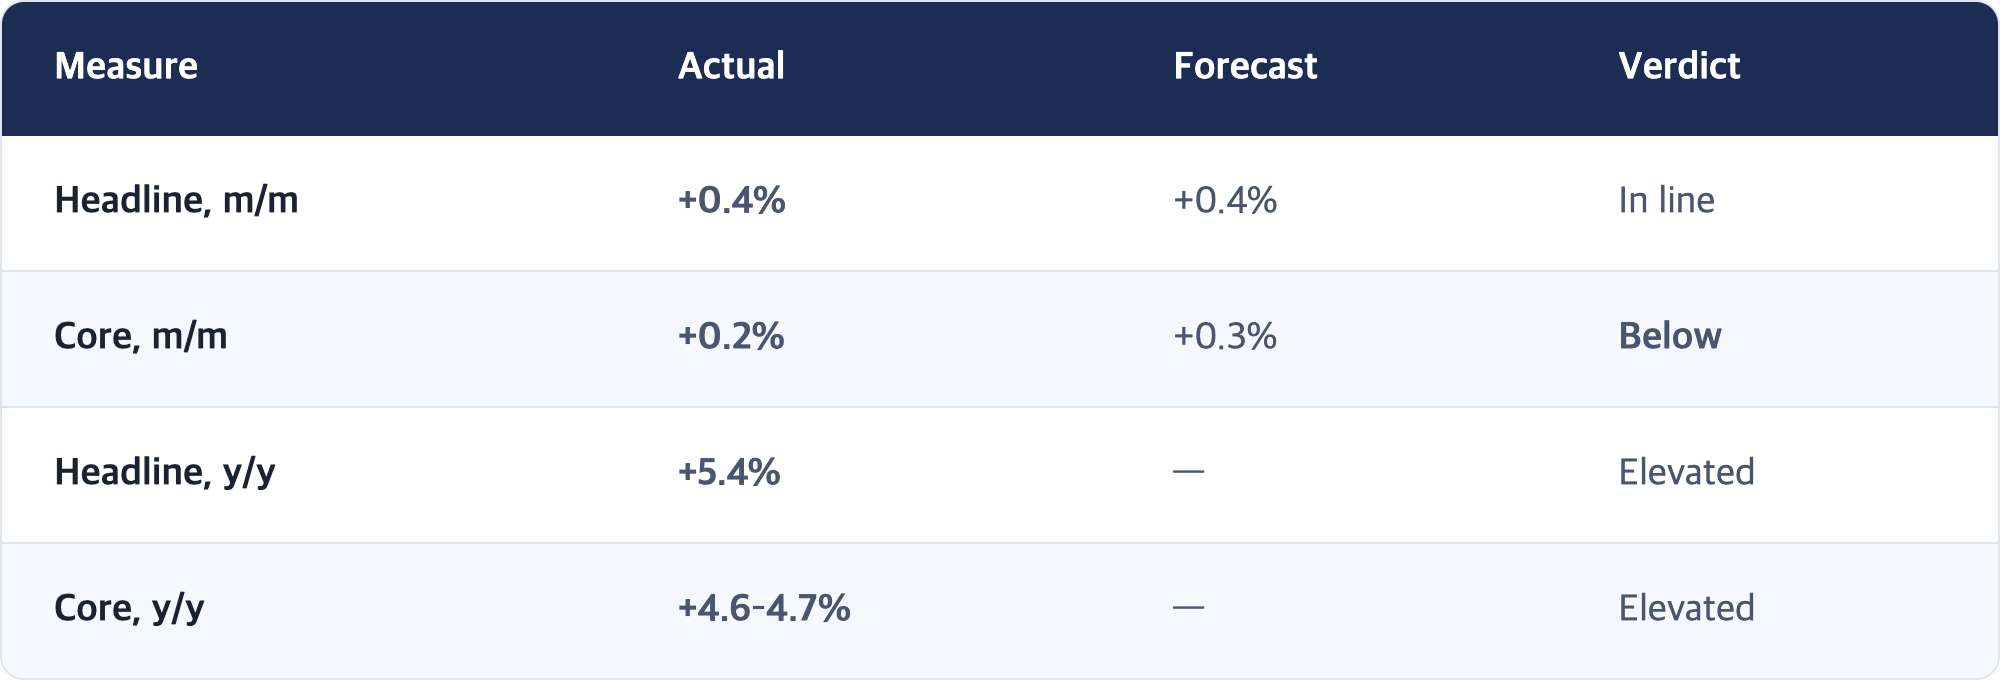
The composition tells you what kind of print this was:
- Final demand goods +1.1% vs final demand services +0.1%
- More than three-quarters of the increase came from final demand energy, +4.2%
- Diesel +24.1% in one month
- Stage-1 intermediate demand +11.3% year-on-year
Weekly jobless claims released the same morning were quiet: initial claims 206,000 (205,000 expected), continuing claims 1.77 million (1.78 million expected).
[Interpretation] Which row of yesterday's table did it hit?
Yesterday's study note laid out three possible shapes. Reproduced exactly:
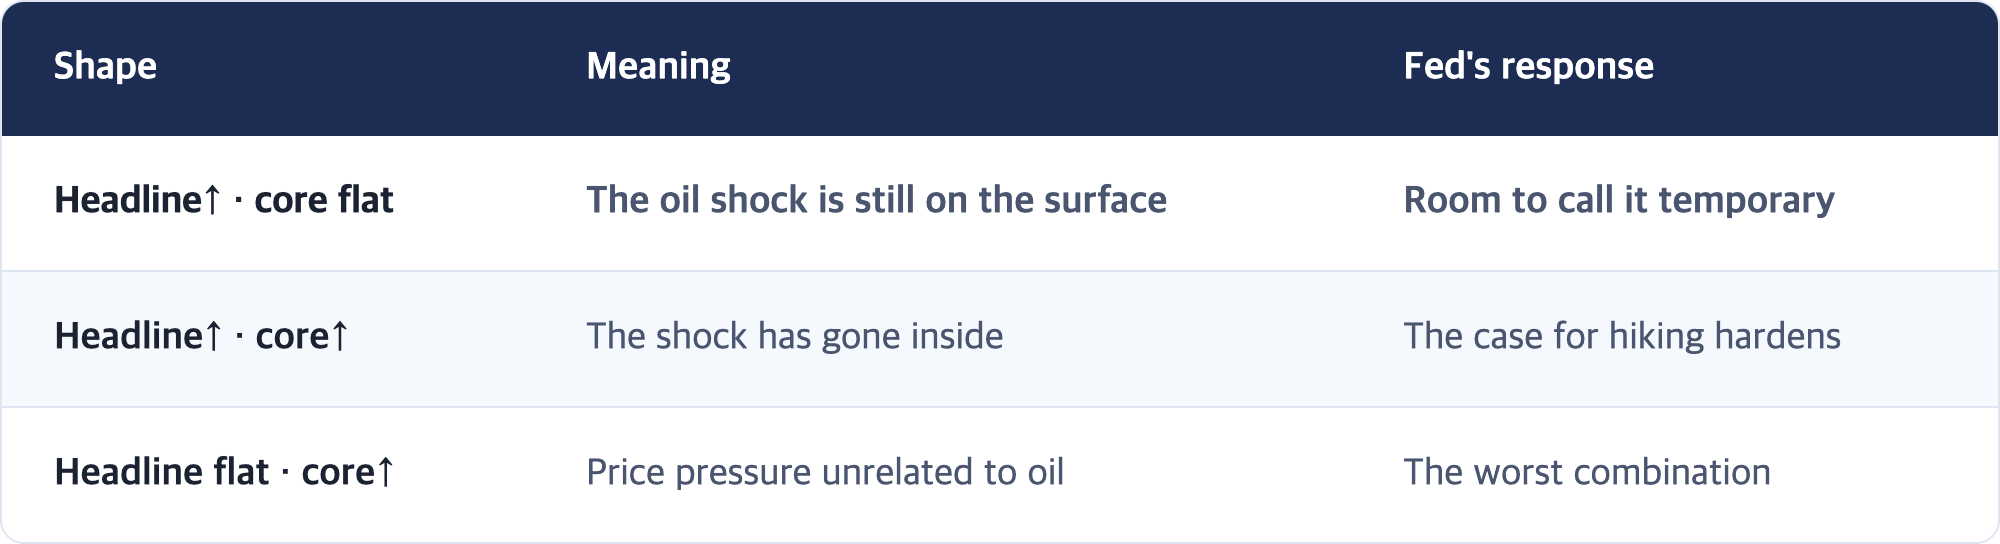
Today's PPI is the first row. Energy pushed the headline; core actually undershot. By yesterday's own standard, this should have been good news for the Fed.
🔴 [Interpretation] Yields went the other way
After the release, the 10-year rose to 4.91% — roughly 8bp above yesterday's 4.845–4.857% close, and the highest since November 2023.
That contrast defines the day.
When good data produces higher yields, it means the data is not what is moving the market. Investors are not trading what happened in August. They are trading what $100 oil, priced today in September, will do to inflation over the next several months.
PPI is an August number. Oil averaged roughly $85–90 a barrel in August. It is $100 now. Today's +0.2% core is a record from a world with $90 oil; the market is pricing a world with $100 oil.
That is why "core came in soft" did not buy any comfort. A good August print cannot walk back September's crude.
[Interpretation] What to call this regime
In one sentence: this is not a regime where data leads the market, but one where commodity prices pre-announce the data.
Normally a data release is the event, and yields and equities move on the result. September 3rd was that kind of day — ISM services ran hot, and then one line from Fed Governor Waller in the afternoon knocked September hike odds from 63% to 50%. Words beat the data that day.
Today was different. Price beat the data. Crude is generating a new number every day, and that number already tells you roughly what next month's inflation print will look like. In that setting, this month's release is closer to a late receipt than to news.
Keep this in mind for tomorrow's CPI. That will also be an August record. Even a friendly print has a short shelf life while oil sits above $100.
2. Korea and Asia Close (Sept 10 KST)
[Fact] Korea, Sept 10 close
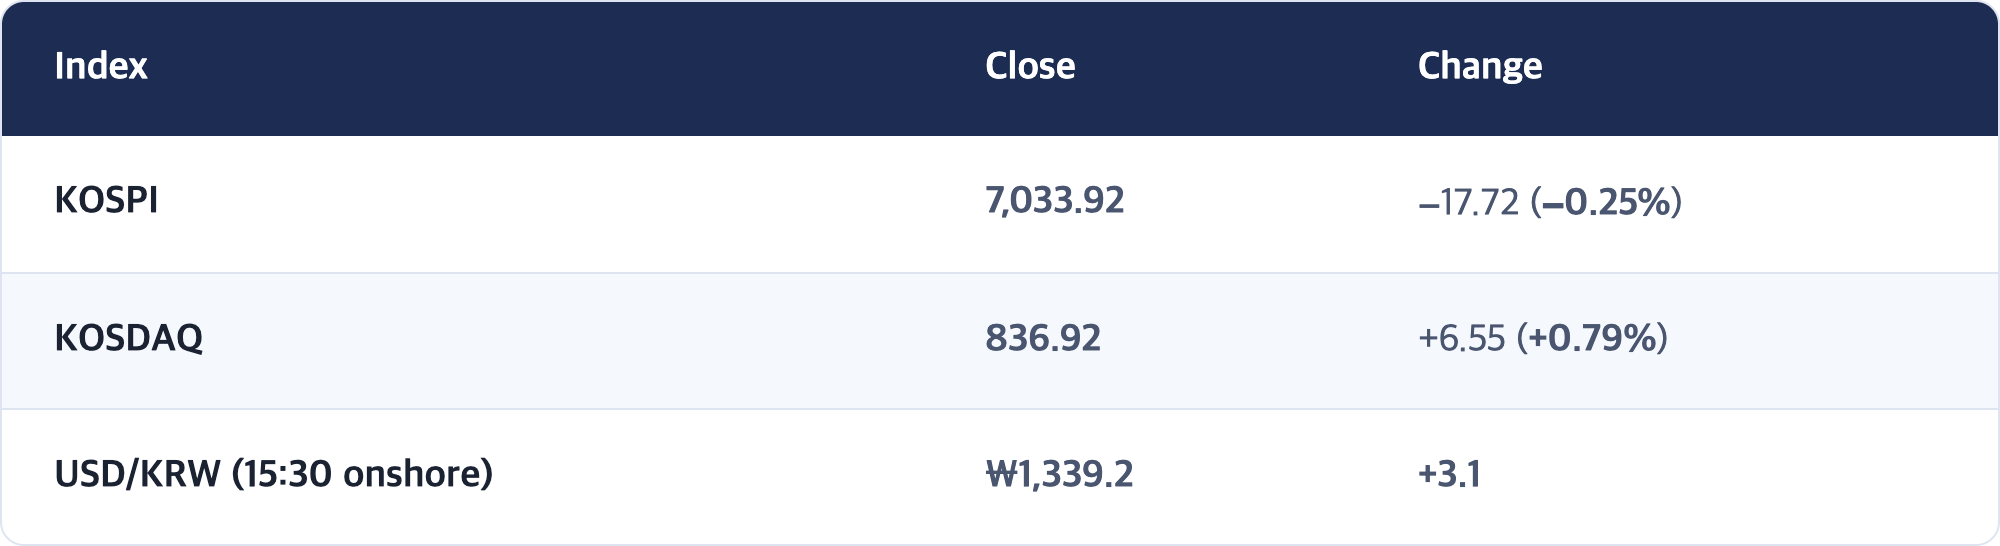
KOSPI opened at 7,035.85 (−12.79) and traded as low as 6,898.45 intraday — then recovered 135.47 points off that low into the close.
[Fact] Flows
[Interpretation] Grading yesterday's checkpoints
Three of the four tests this report set yesterday were answered today.
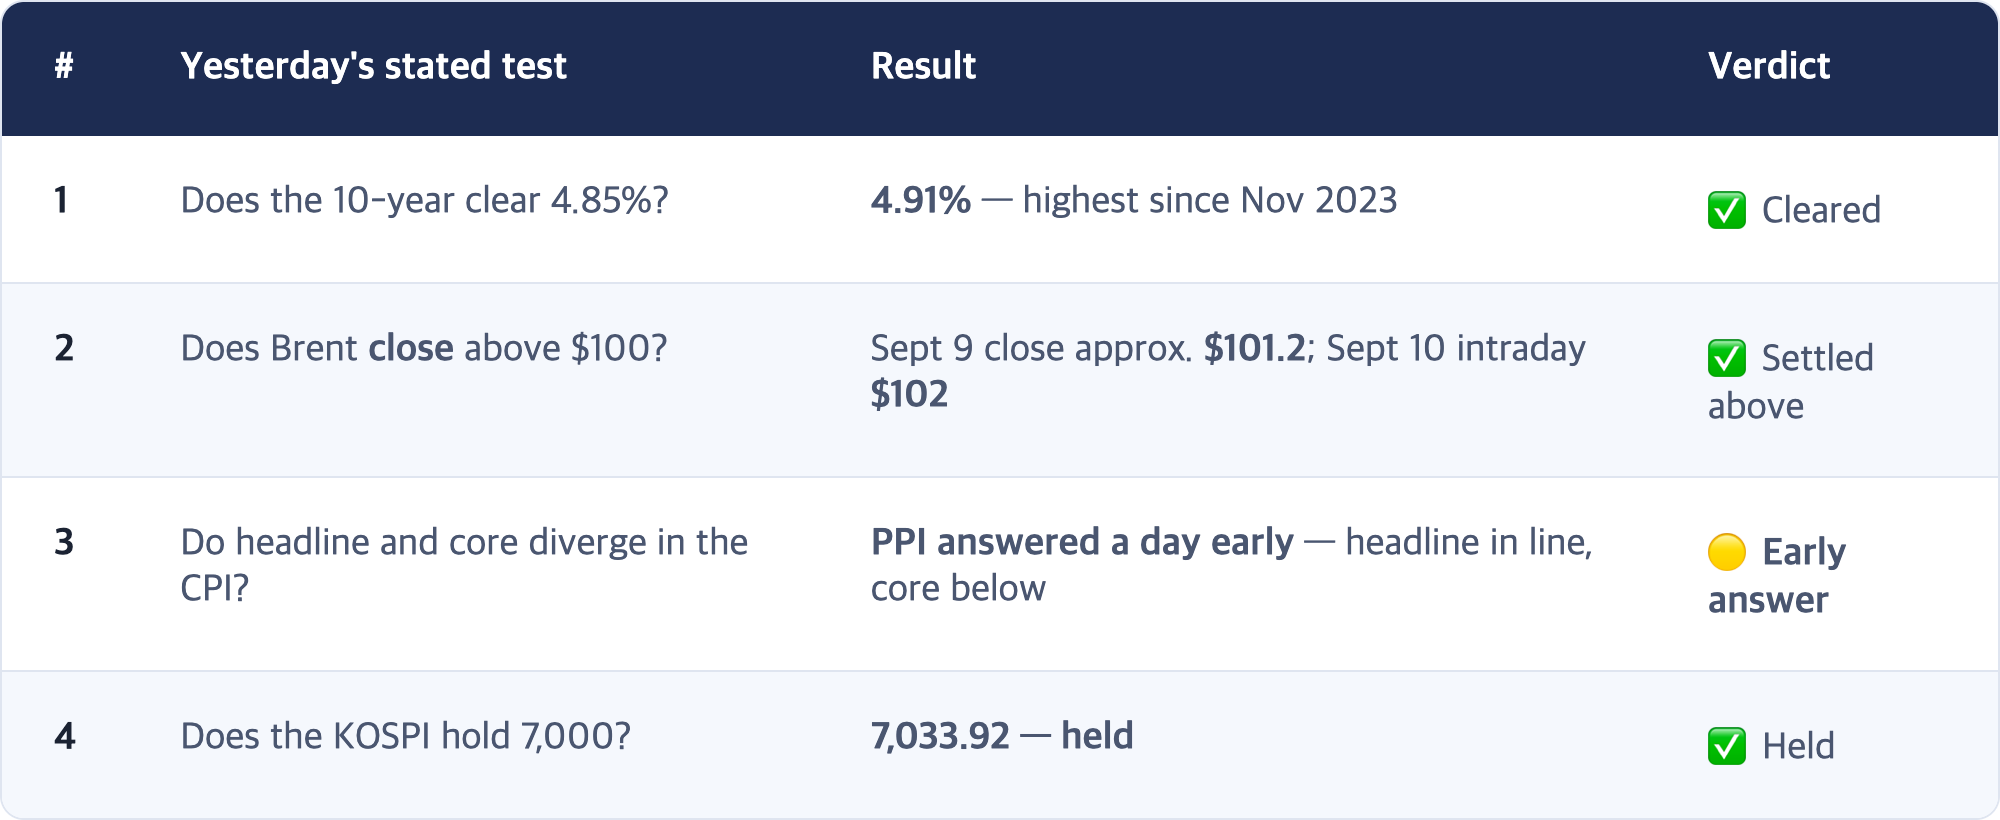
Three answered in the expected direction, and one answered a day earlier than expected.
But test 4 needs an honest footnote. Holding is not the same as being strong.
🔴 [Interpretation] It held the opposite way from yesterday
Put the two sessions side by side:
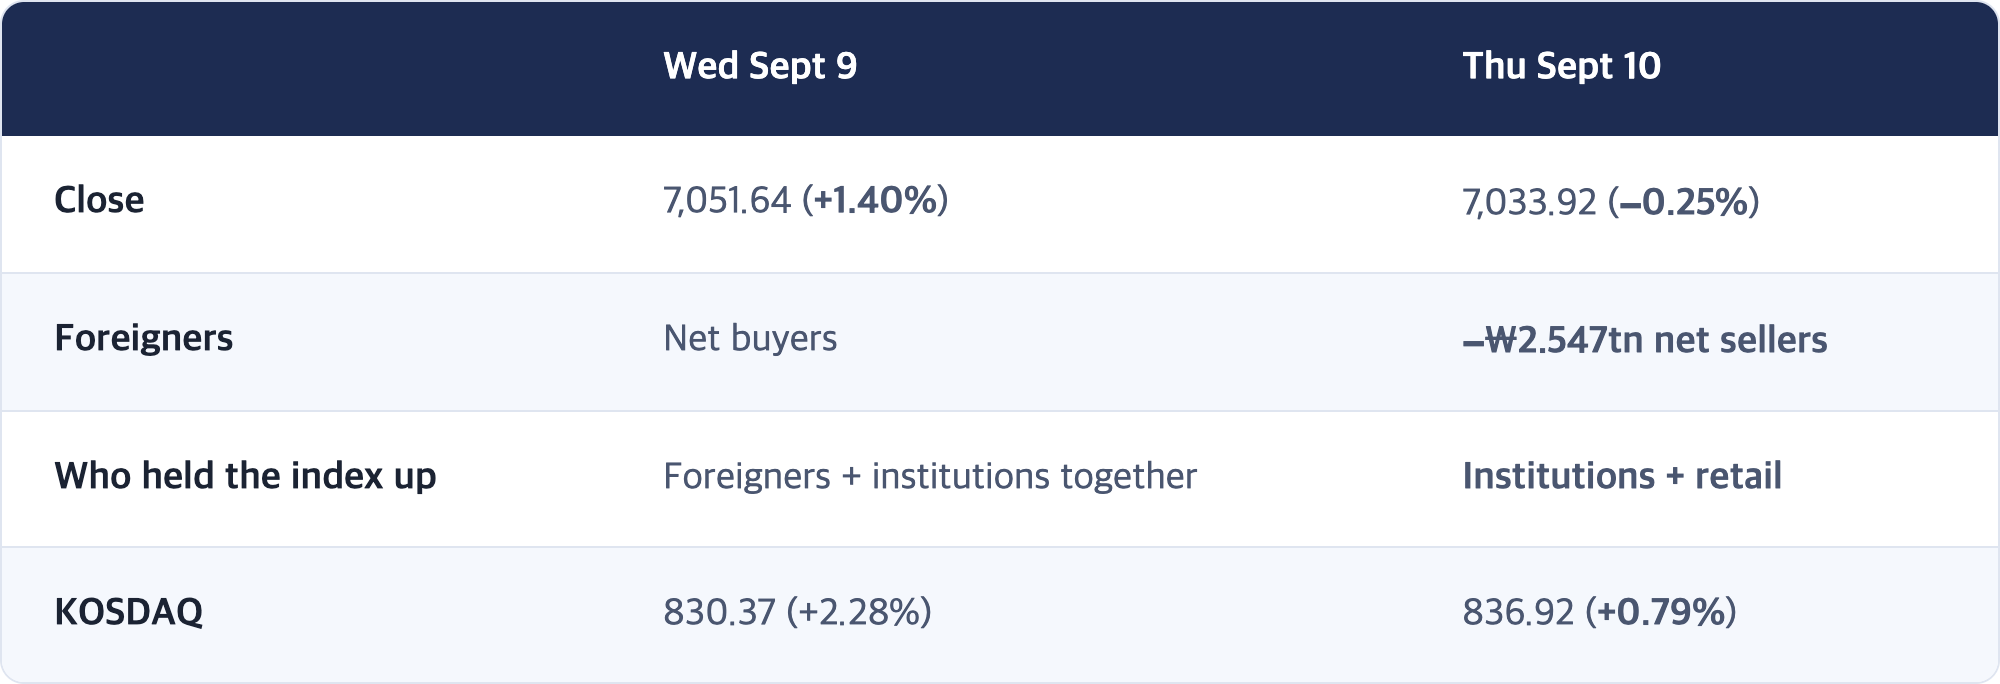
Yesterday it rose because foreigners bought. Today it did not break while foreigners sold. Those are not the same "above 7,000."
One number captures it: the intraday low of 6,898.45. The KOSPI gave up 7,000 during the session and climbed back — 135 points of recovery built by domestic money, not foreign money.
The KOSDAQ's gain completes the picture. Institutions bought ₩1.3 trillion of small and mid caps while foreigners sold large caps. Domestic money filled the space foreign money vacated — but not the same space.
How to read that is genuinely contested. It can mean the floor is thick, or it can mean domestic money alone cannot absorb foreign selling for long. One session does not settle it, which is why the question is carried straight into today's checkpoints.
[Fact] Asia, Sept 10 close
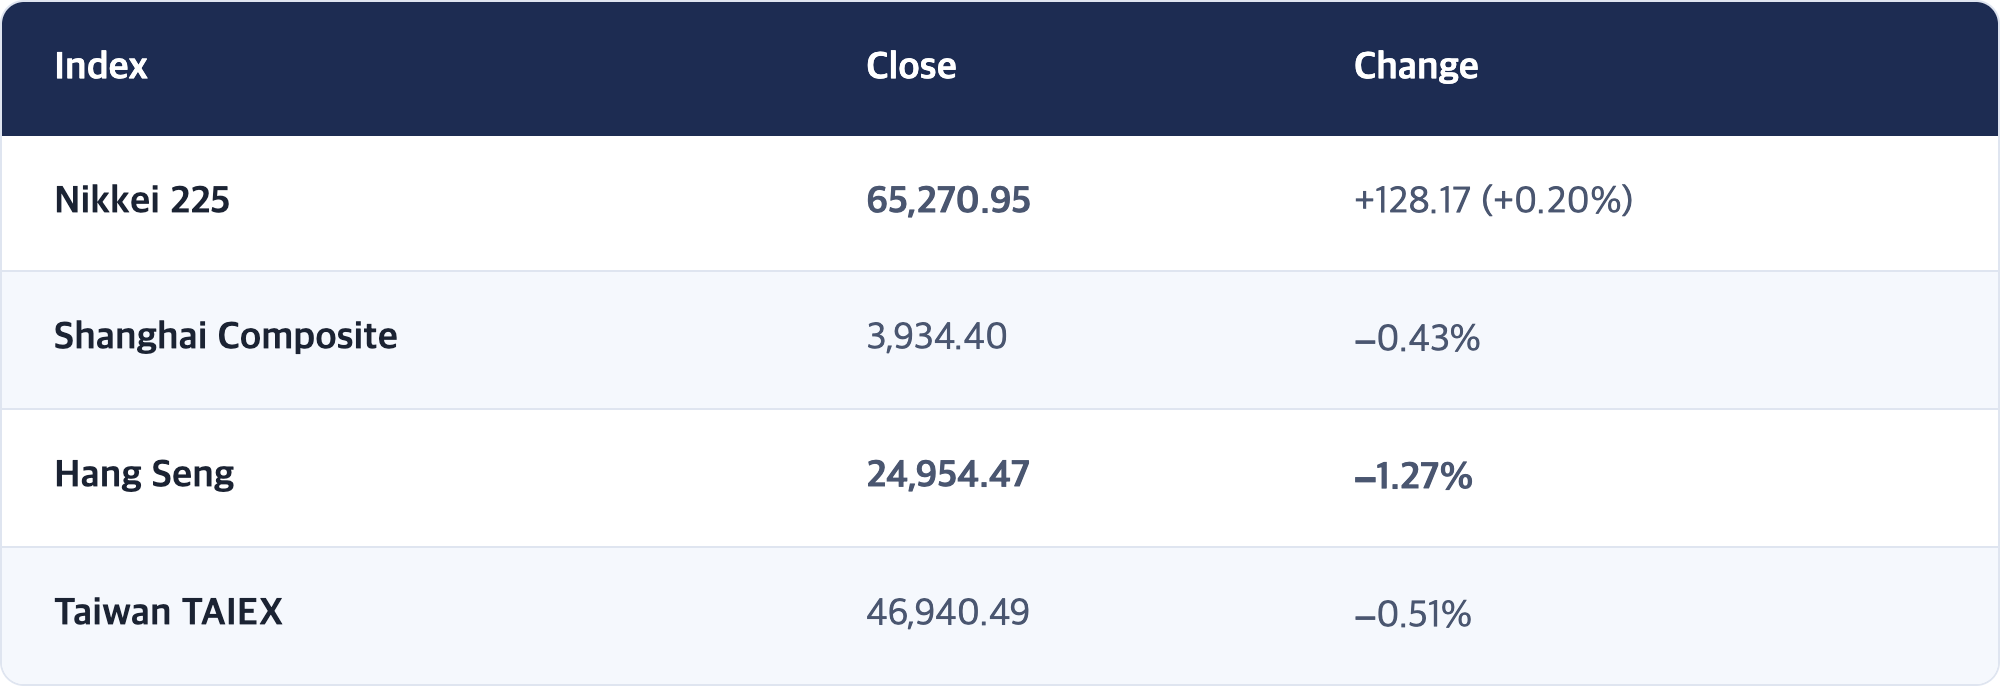
Japan was the only Asian market to close higher — and only after reversing an opening decline.
3. The US Variable (Sept 10 intraday, approx. 10:35 ET)
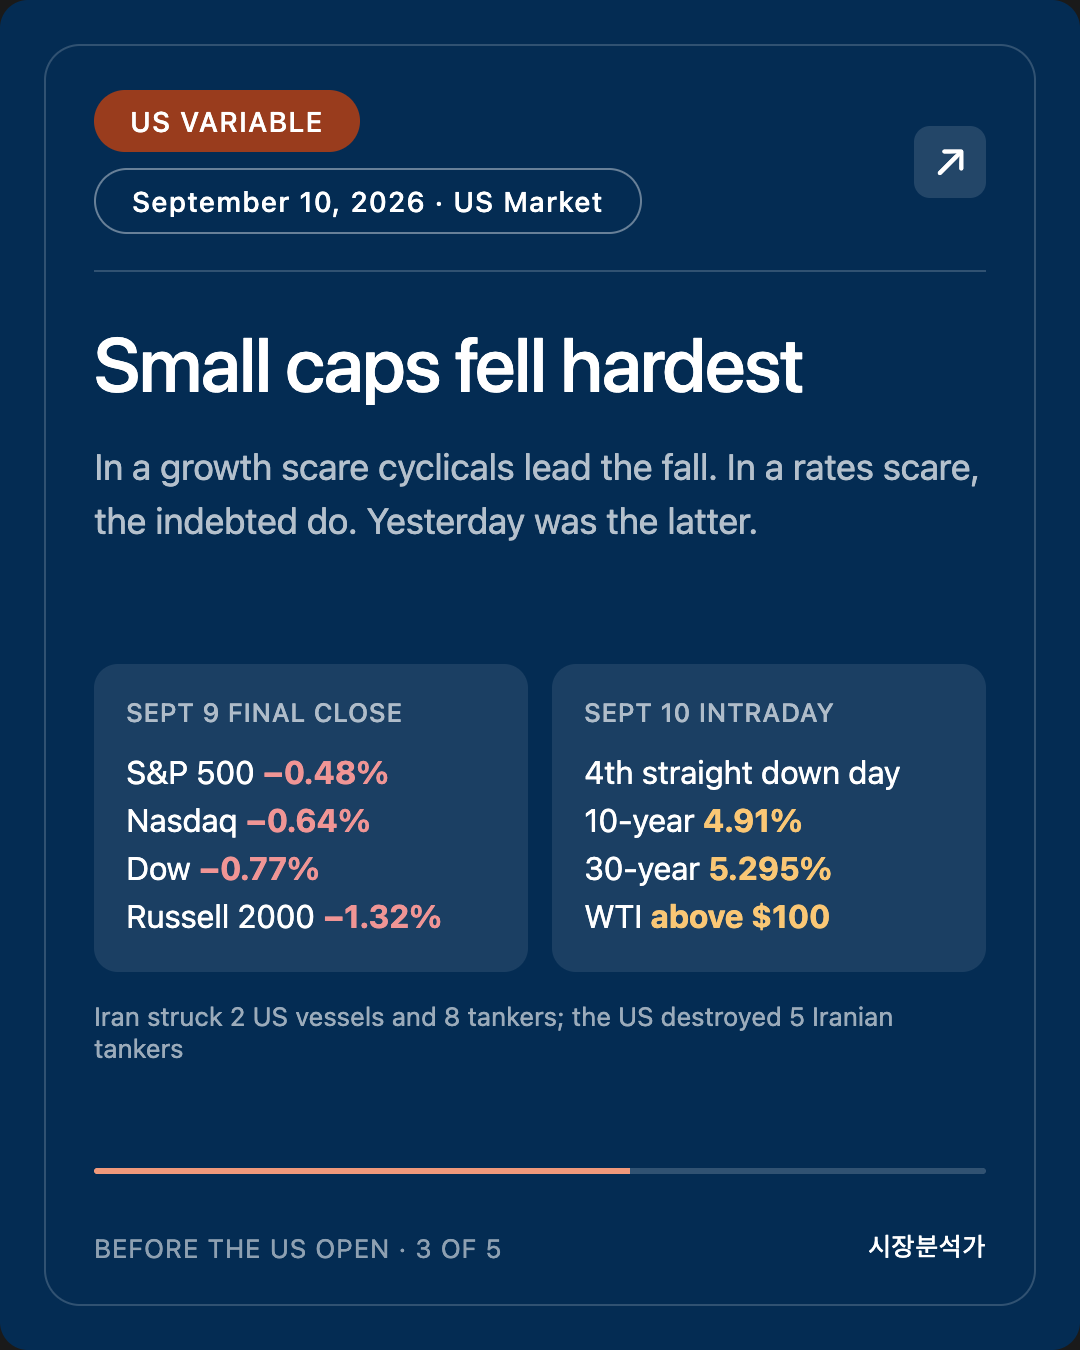
[Fact] US Sept 9 final closes
[Fact] US Sept 10 intraday
- Dow approx. −0.3–0.4%, S&P 500 approx. −0.5–0.6%, Nasdaq approx. −0.8–0.9% — a fourth straight down day in progress
- 10-year 4.91% (+8bp) · 30-year 5.295% · 2-year 4.436%
- WTI above $100 (highest since May) · Brent $102.03
- Gold $4,405–4,429 · DXY 99.07
[Observation] The Russell 2000 fell hardest
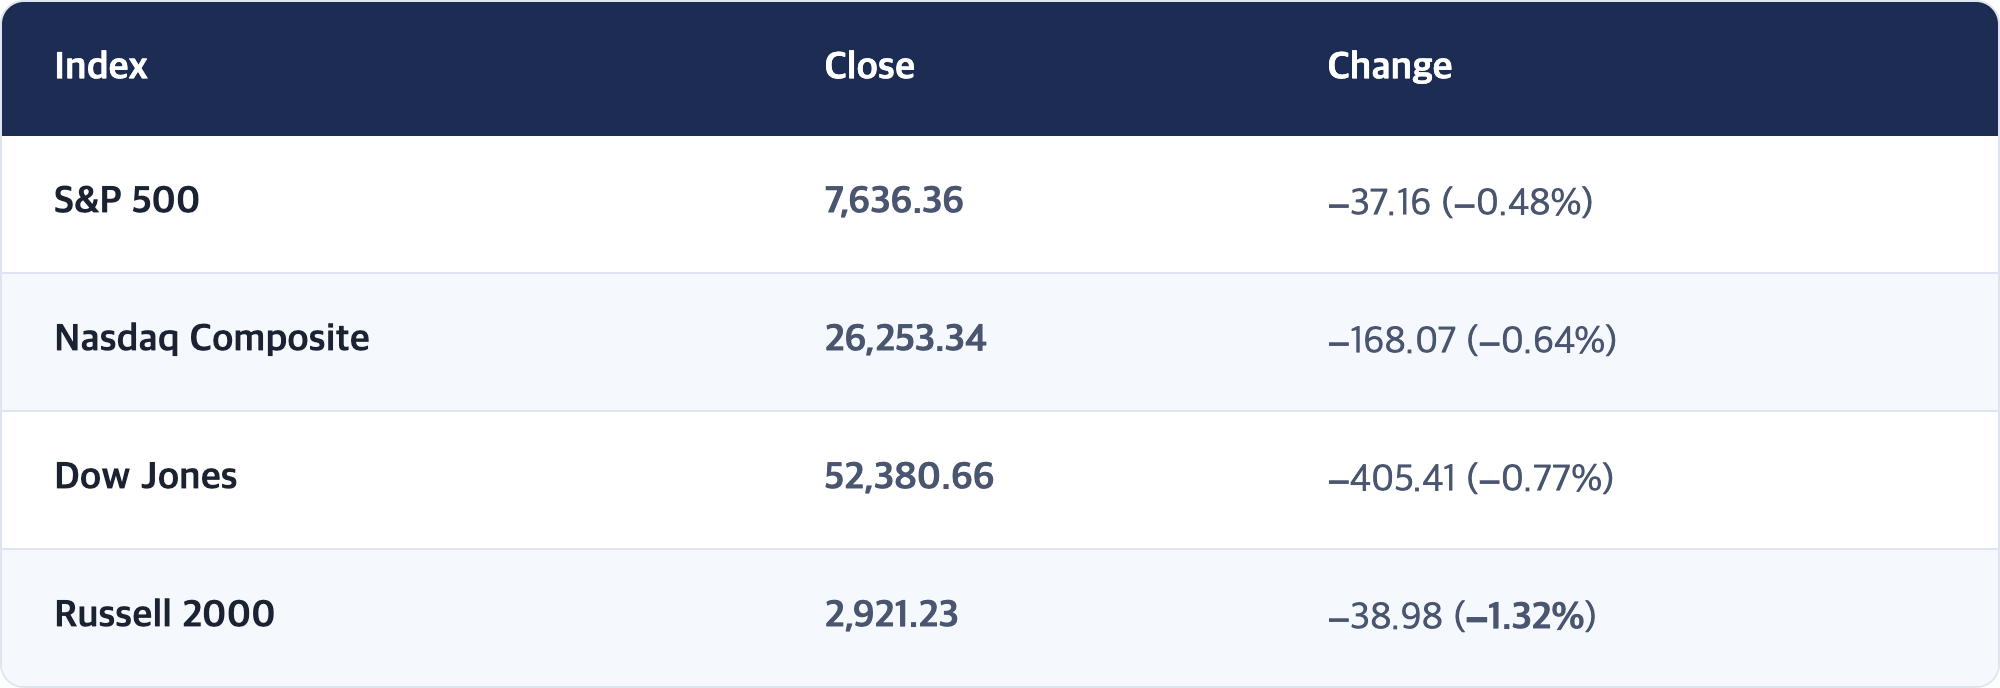
The striking number in yesterday's US session is the Russell 2000 at −1.32% — nearly three times the S&P 500's decline.
The Russell tracks small and mid caps. When it underperforms this sharply, it tells you where higher rates bite first. Smaller companies carry more floating-rate debt; when yields rise, the interest expense shows up in the income statement immediately. Large caps termed out cheap fixed-rate debt years ago and have time.
So the market is not pricing "growth is cracking." It is pricing "money costs more." In a growth scare, cyclicals lead the fall; in a rates scare, the indebted do. Today it is the latter.
[Fact] Geopolitics — Hormuz
- Iran's Revolutionary Guards said they struck two US vessels and eight tankers in the Gulf
- The US destroyed five Iranian tankers
- Brent cleared $100 for the first time since July, is up about 14% in a month, and roughly 66% year-to-date
Note the character of these events. Data releases have scheduled dates, so markets can prepare. Naval exchanges do not consult a calendar. That matters especially for this weekend — see the checkpoints.
4. Macro Backdrop — Three Central Banks in One Week
[Fact] ECB decision, Sept 10
- Policy rates raised 25 basis points
- Deposit facility 2.50% · main refinancing 2.65% · marginal lending 2.90%
- Lagarde: "The Governing Council did not discuss the future rate path"; said she was surprised by economic resilience; inflation seen returning to target towards the end of 2027 (2026 average 3.0%, 2027 2.5%)
[Fact] The week ahead
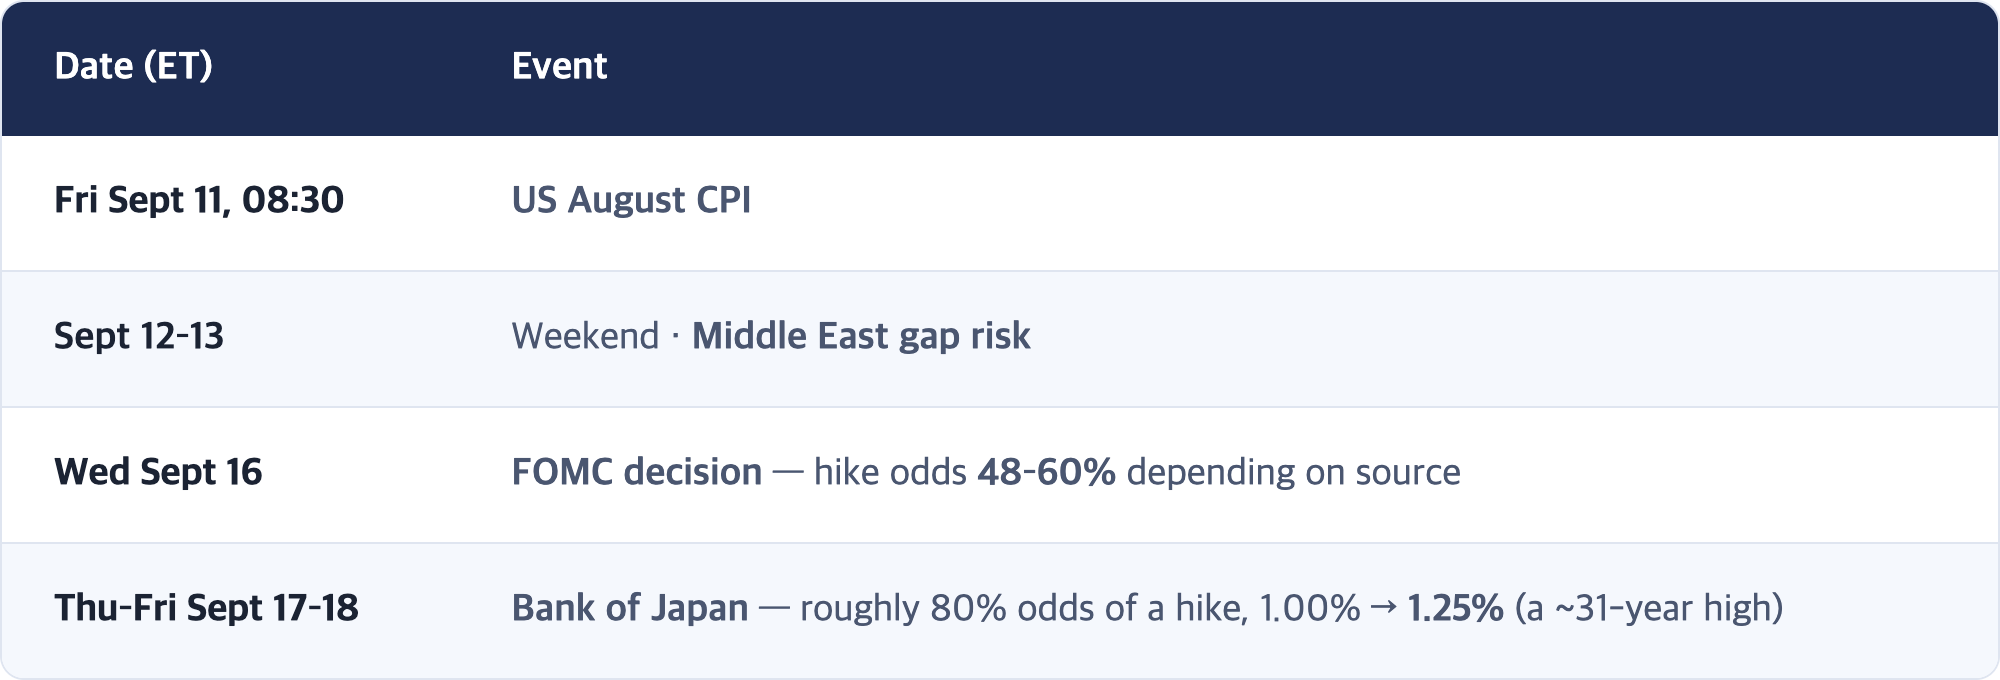
USD/JPY sits near 153.4, the yen's strongest since February. Japanese wage growth at its fastest since 1997 has pushed hike expectations higher.
[Interpretation] What happens when all three look the same way
The ECB hiked today, the Fed is a coin flip next Wednesday, and the BoJ is an 80% bet two days later. This is the first week in 2026 that three major central banks are pointed in the same direction.
For two years the configuration was the opposite: the Fed and ECB easing, the BoJ alone tightening. That gap drove the yen to a 40-year low and made it the cheap fuel behind risk assets worldwide — the carry trade.
That gap is now closing, because oil is lifting inflation in all three economies at once. When the shock is shared, so is the prescription.
For Korea, the question is where the won lands. The won weakened 3.1 to 1,339.2 today after two sessions of strengthening. In a world where three central banks tighten together, the won's position is awkward — the rate gap works against it versus the dollar, it falls alongside the yen, and Korea imports every barrel it burns. Next week is the week that settles that position.
[Interpretation] A note on Korea's long-term bulls
Jinkyu follows four Korean market commentators (Kwak Sang-jun, Park Si-dong, Lee Kwang-soo, Lee Sun-yeop) who share a broadly constructive long-term view of Korean equities centred on the semiconductor cycle. Today's session does not contradict them — an index that closes above 7,000 while foreigners dump ₩2.5 trillion is evidence of a thick floor.
But there is one variable their shared thesis does not address: the discount rate. Their arguments live mostly in earnings and cycle — the numerator. What is moving right now is the denominator. A good numerator still loses to a growing denominator. How long oil-driven yields persist decides that denominator.
Do not read this as "they are wrong." These are claims on different time horizons, and they do not refute each other. Both can be true.
5. Checkpoints — The Rest of Today and This Week
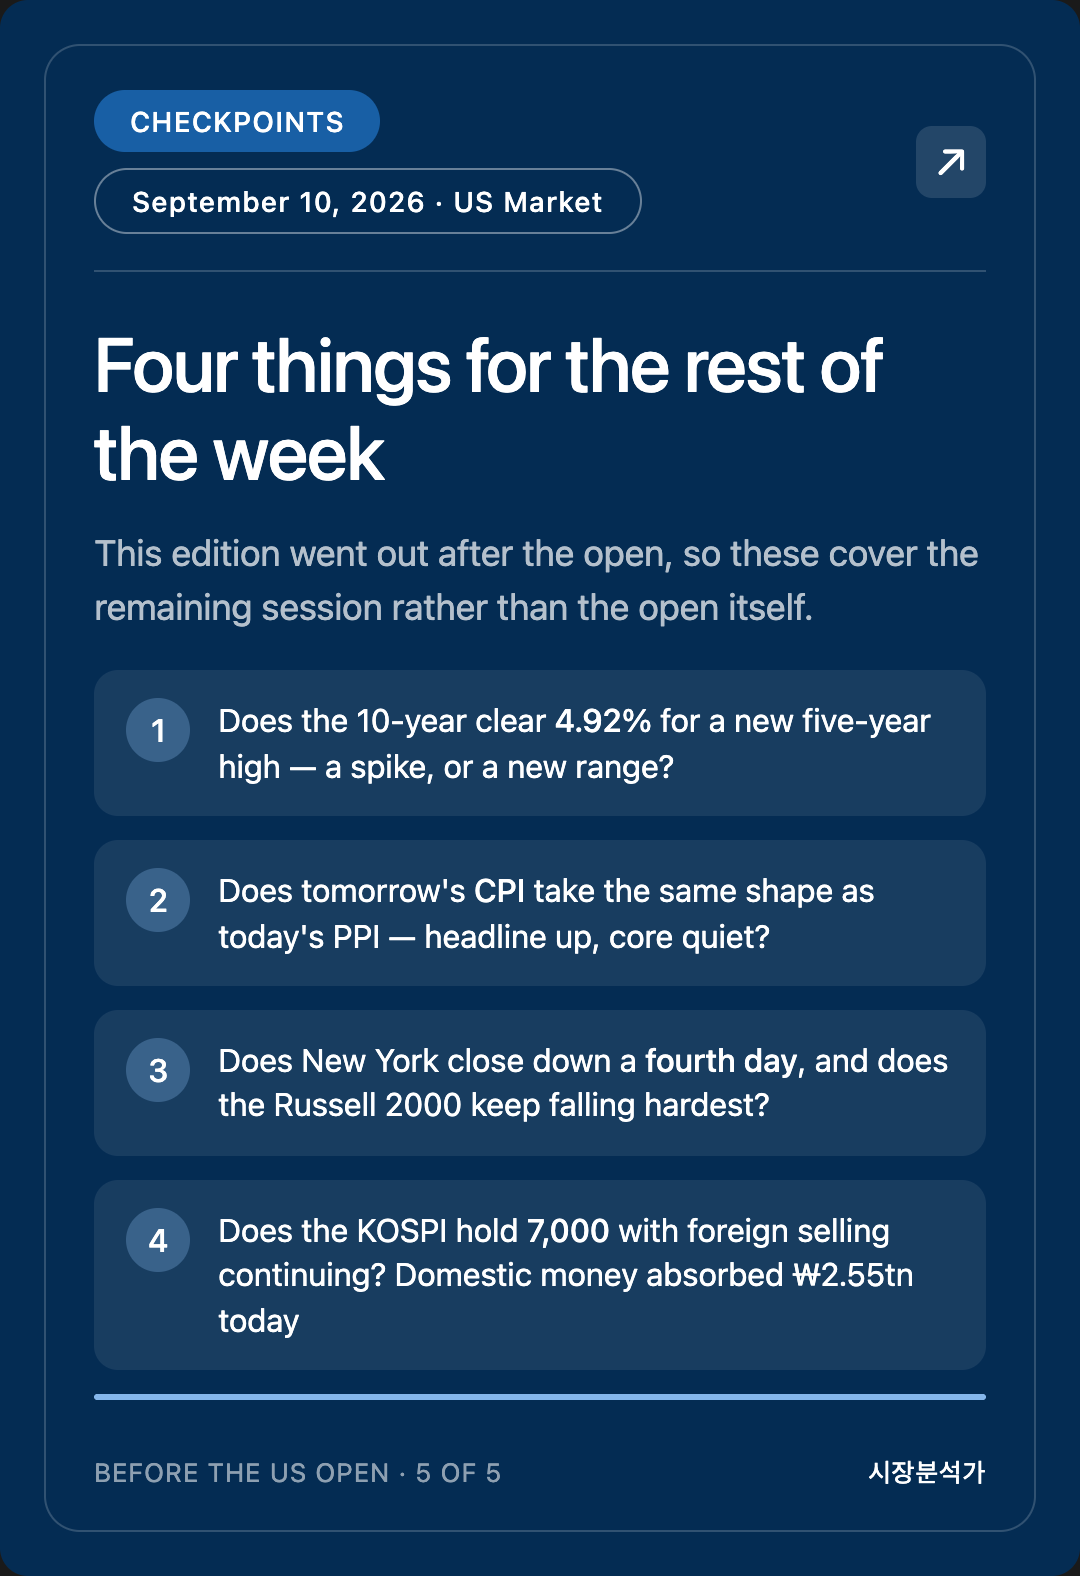
This edition again went out after the open, so the checkpoints are framed as "what to watch in the remaining session and this week."
1. Does the 10-year clear 4.92% and set a new five-year high?
Axis — is the oil-driven move a spike or a new range?
It sits at 4.91%, just under the five-year peak of 4.92%. Clearing it means the market is pricing $100 oil as a multi-month condition. Falling back below 4.85% means today's move was an overreaction to the PPI print.
2. Does tomorrow's CPI take the same shape as today's PPI — headline up, core quiet?
Axis — do the two inflation gauges tell the same story?
Core PPI undershot today. If core CPI is also quiet, the Fed has two data points supporting the "temporary supply shock" reading. If core CPI runs hot, today's PPI was the exception and the hiking case hardens. Divergence is the harder outcome for markets.
3. Does New York close down for a fourth straight day, and does the Russell 2000 keep falling hardest?
Axis — is this a rates correction or a growth scare?
While the Russell keeps underperforming large caps, this remains a rates story. The moment cyclical large caps start falling harder than the Russell, the market has moved to a growth story — and the whole interpretive frame has to change.
4. Does the KOSPI hold 7,000 tomorrow even with foreign selling continuing?
Axis — was today's defence domestic strength or a one-day accident?
Institutions and retail absorbed ₩2.55 trillion of foreign selling today. A repeat tomorrow builds a second piece of evidence for a thick floor. A break means today was simply one round of dip-buying. The real question is how many sessions domestic money can keep absorbing.
[Interpretation] About the weekend
Friday's CPI and a live Middle East situation overlap this weekend, and when markets reopen Monday there will be only two days left before the FOMC.
Do not read this as a directional call. It describes where the calendar sits, not whether prices go up or down. But it is worth knowing that the window for new information to arrive over a weekend is wider than usual.
📖 Study Note — Why Yields Rise on Good Data: the Term Premium
This morning was a textbook case, so it is worth walking through.
Concept — A long yield is made of two pieces
The 10-year yield looks like one number, but two different things live inside it.
First: the expected average of short-term rates over the next ten years. This is the market's view of where the Fed will hold policy. This piece responds to economic data. Soft inflation pushes it down.
Second: the term premium. This is the extra compensation investors demand for committing money for ten years — "a lot can happen in a decade, pay me for it." This piece responds not to data but to the size of the uncertainty.
This morning the first piece had every reason to fall (core inflation undershot), and the second piece rose by more.
Analogy — Rent and the deposit on the same apartment
Think of a ten-year bond as a ten-year lease.
The first piece is the rent. It is set by comparable listings in the neighbourhood. When the local market softens, rent softens.
The second piece is the security deposit. The landlord sets it not from current listings but from "what could go wrong over ten years." If a redevelopment rumour starts circulating, the deposit goes up regardless of what rents are doing.
Oil is that rumour right now. Even if August's listings (the PPI) came in soft, a wider ten-year uncertainty raises the deposit.
In practice — why oil specifically
Energy prices lift the term premium more than most variables, for three reasons.
1. It is the input to every other price. Diesel rose 24.1% in a single month in today's PPI. Diesel moves trucks, ships and farm equipment. Today's energy price is the price of everything, a few months out. Markets know this and price it in advance.
2. Central banks cannot control it. As yesterday's note put it: raising rates does not reopen the Strait of Hormuz. A shock that policy cannot reverse leaves uncertainty in place longer.
3. Its direction is unforecastable. Data releases have dates and consensus estimates. Naval clashes have neither. The less predictable the risk, the larger the compensation demanded.
Which produces a day like today. The data was good and yields rose. Both statements are true; they belong to different pieces.
How to use this
Next time a soft inflation print is met with higher yields, split it in two:
- Yields moved with the data → the first piece is driving. An ordinary day.
- Yields moved against the data → the second piece is driving. Something larger than the release has hold of the market — finding out what it is becomes the job of the day.
Today it was the second, and the something was oil.
⚠️ Corrections and Open Items
1. 🔴 The AM edition has now run late two days in a row. Sept 9 was 3 hours 55 minutes late (05:30 → 09:25); today was 1 hour 39 minutes (05:30 → 07:09). Both started after the US open (06:30 PDT). The Sept 8 PM edition ran on time, so this looks specific to the AM schedule — and it is now a pattern, not a one-off. Today's delay happened to let us capture the 08:30 ET PPI release and the reaction together; a good outcome does not make the mechanism sound, so the cause still needs checking.
2. ✅ The SK Hynix price-level discrepancy is resolved. Left open yesterday. The confirmed Sept 10 close is ₩1,858,000 (−0.16%), so the ₩1.86 million level is correct. The ₩162,200 figure from one source yesterday is not adopted. This is consistent with the ₩1,889,000 intraday print cited yesterday.
3. 🔴 KOSPI flow figures differ materially between sources. Money Today reports foreigners −₩2.547tn, institutions +₩511.9bn, retail +₩366.7bn. Businesskorea reports foreigners −₩2.714tn, retail +₩2.542tn, institutions +₩158bn. The retail figure differs by roughly sevenfold. This report adopts Money Today, which also broke out KOSDAQ flows. Note that on those figures the three investor groups net to −₩1.668tn, leaving a residual attributable to "other corporates" that we could not source. (Corporate buybacks filled exactly that gap in several late-August and early-September sessions, so the same structure is plausible — but it is an unverified inference and is not used in the interpretation above.)
4. 🔴 KOSDAQ close misreported in one source. Businesskorea gave 1,021.45 (+0.38%), while Asia Economy, Money Today and Etoday all report 836.92 (+6.55, +0.79%). 836.92 is adopted.
5. 🔴 Conflicting direction on USD/KRW. Businesskorea wrote "₩1,339.20, down 4.3"; Financial News and Money Today wrote "up 3.1 to ₩1,339.2." Since the Sept 9 onshore close was ₩1,336.1, +3.1 is arithmetically correct. A weaker won is adopted.
6. 🔴 Conflicting USD/JPY quotes. Investrade's morning note showed 163.74; FXStreet and Trading Economics show approximately 153.4. 153.4 is adopted, consistent with the 152.89 confirmed in the Sept 8 edition. The 163.74 appears to be an error but could not be confirmed as such.
7. Core PPI is defined differently across sources. Some report core y/y at 4.6% (ex food and energy), others at 4.7% (ex food, energy and trade services). This is a definitional difference, not an error. The report uses the 4.6–4.7% range.
8. 🔴 September FOMC odds remain un-unified for a fourth consecutive edition. This round: CME FedWatch 56–60%, Kalshi 48%, Polymarket 49% — a spread of up to 12 percentage points. The report uses the 48–60% range. The interpretation ("a coin flip leaning slightly toward a hike") is identical across all sources.
9. 🔴 The SOX semiconductor index close is unsourced for a third consecutive edition. No update since the Sept 4 close of 11,735.26. For reference, the SOXX semiconductor ETF was at 528.40 on Sept 9. Semiconductor index references were dropped from the body.
10. VIX quotes conflict. One source shows 14.15 (−1.19%), another 15.85. Not cited in the body.
11. All US Sept 10 figures are intraday, not closes. The 4.91% 10-year, the index percentage moves, and the WTI and Brent prices are as of approximately 10:35 ET. Final closes will be reconciled in tonight's Before the Korean Open edition.
12. Brent's Sept 9 settlement could not be pinned down exactly. Sources give $100.76, "above $101," or Sept 10's $102.03 (+0.83). The body uses approximately $101.2 as a back-calculated figure and otherwise states only the fact of a close above $100.
13. European closing levels were again not obtained. DAX 25,566 (−10) and FTSE 100 10,628 (−41) are intraday levels as of the US pre-open.
🔗 Sources
- Asia Economy — KOSPI 7,033.92 close; KOSDAQ 836.92 close
- Money Today — "KOSPI defends 7,000 despite oil and yields; KOSDAQ closes higher" (flows, stocks, FX)
- Businesskorea — KOSPI closing wrap (used for flow comparison)
- Financial News — USD/KRW ₩1,339.2, up ₩3.1
- Etoday — Asian markets lower ahead of US CPI; Japan alone +0.20%
- U.S. Bureau of Labor Statistics — Producer Price Index News Release Summary, 2026 M08
- Yahoo Finance — "Dow, S&P 500, Nasdaq extend losses as bond yields jump, oil holds above $100" (PPI detail, 10-year at 4.91%, jobless claims)
- CNBC — "PPI inflation report August 2026"
- Investrade — "Morning Preview: September 10, 2026" (Sept 9 closes, futures, Asia, Europe, commodities)
- TheStreet — "Stock Market Today (Sept. 9, 2026): Dow, Russell 2000 fall as Brent passes $101/bbl"
- CNBC — "An ECB rate hike is 'all but certain' — but investors divided on what comes next"
- FXStreet — Lagarde press conference wires (no debate on rate path; economic resilience; target by end-2027)
- FXStreet — "Japanese Yen remains firm against US Dollar amid hawkish BoJ bets"
- CNBC — "Iran attacks U.S. vessels, oil tankers in Hormuz in retaliation"
- Army Recognition — "Iran Fires Ballistic Missiles at U.S. Navy Carrier and Destroyer as U.S. Strikes 3 Oil Tankers"
- Washington Times — "Brent crude hits $100 a barrel as Iran war escalates"
- Forbes / Yahoo Finance / KuCoin — CME FedWatch September hike odds (sources disagree)
📌 More market briefs
※ This post is market observation and organization intended to support your own judgment. It is not a recommendation to buy or sell any security. Figures are as of the time of writing and may differ between sources.
If this was useful, bookmark it or pass it along. It genuinely helps me write the next one.
I can survive. We can survive.