September 11, 2026 US Market Brief — Nasdaq and S&P 500 Before the Open
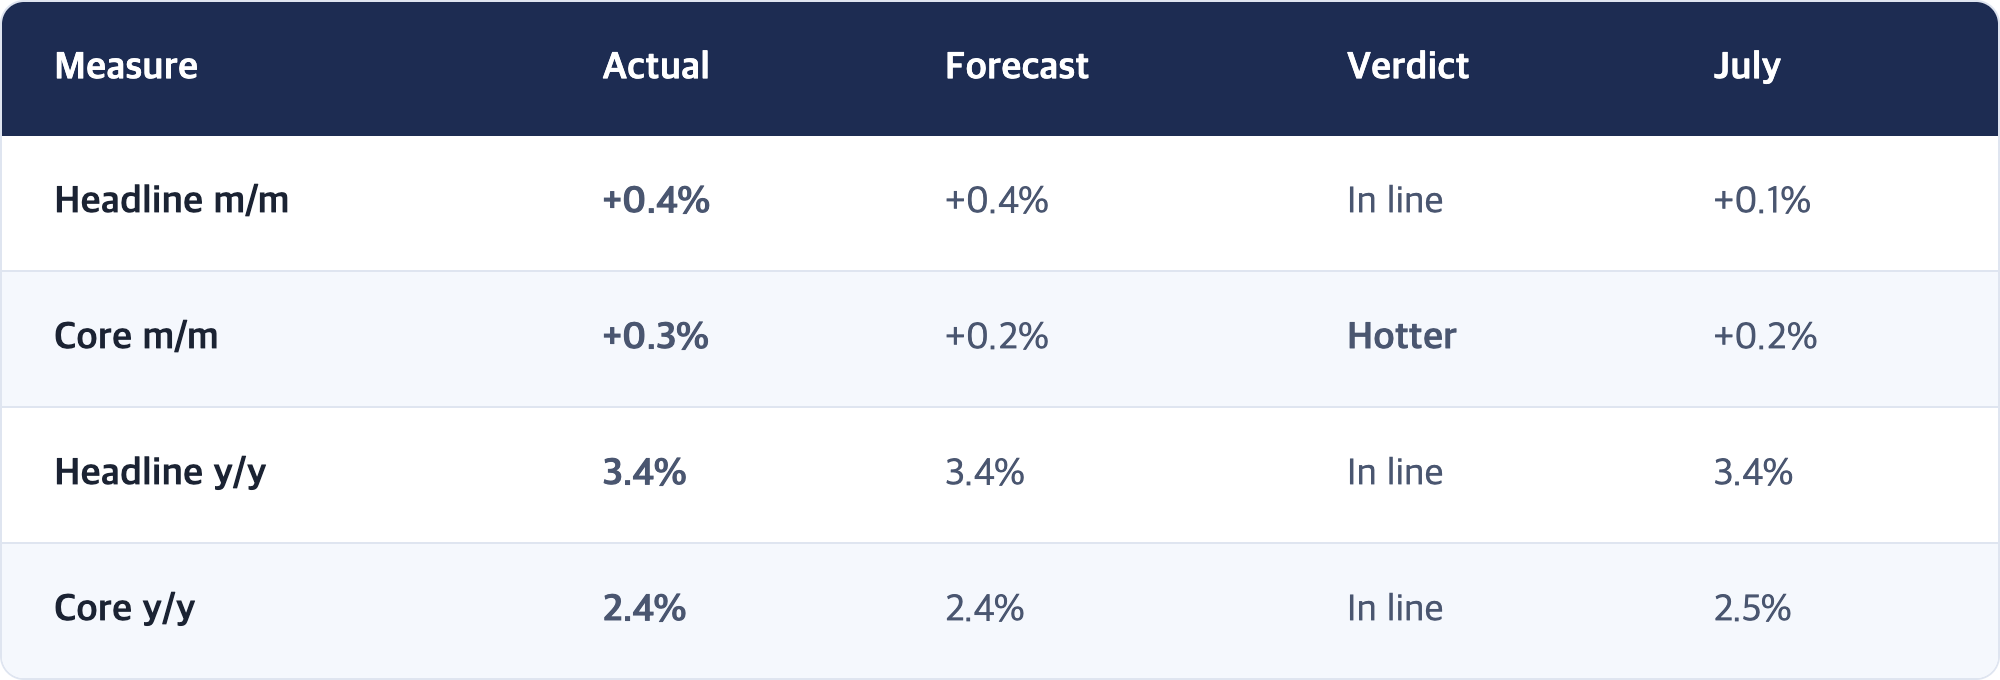
- US August CPI: headline +0.4% (in line), core +0.3% (above the +0.2% forecast). Year-on-year, headline 3.4% and core 2.4% both matched expectations. Gasoline jumped 3.9% in a month, accounting for more than a third of the headline increase.
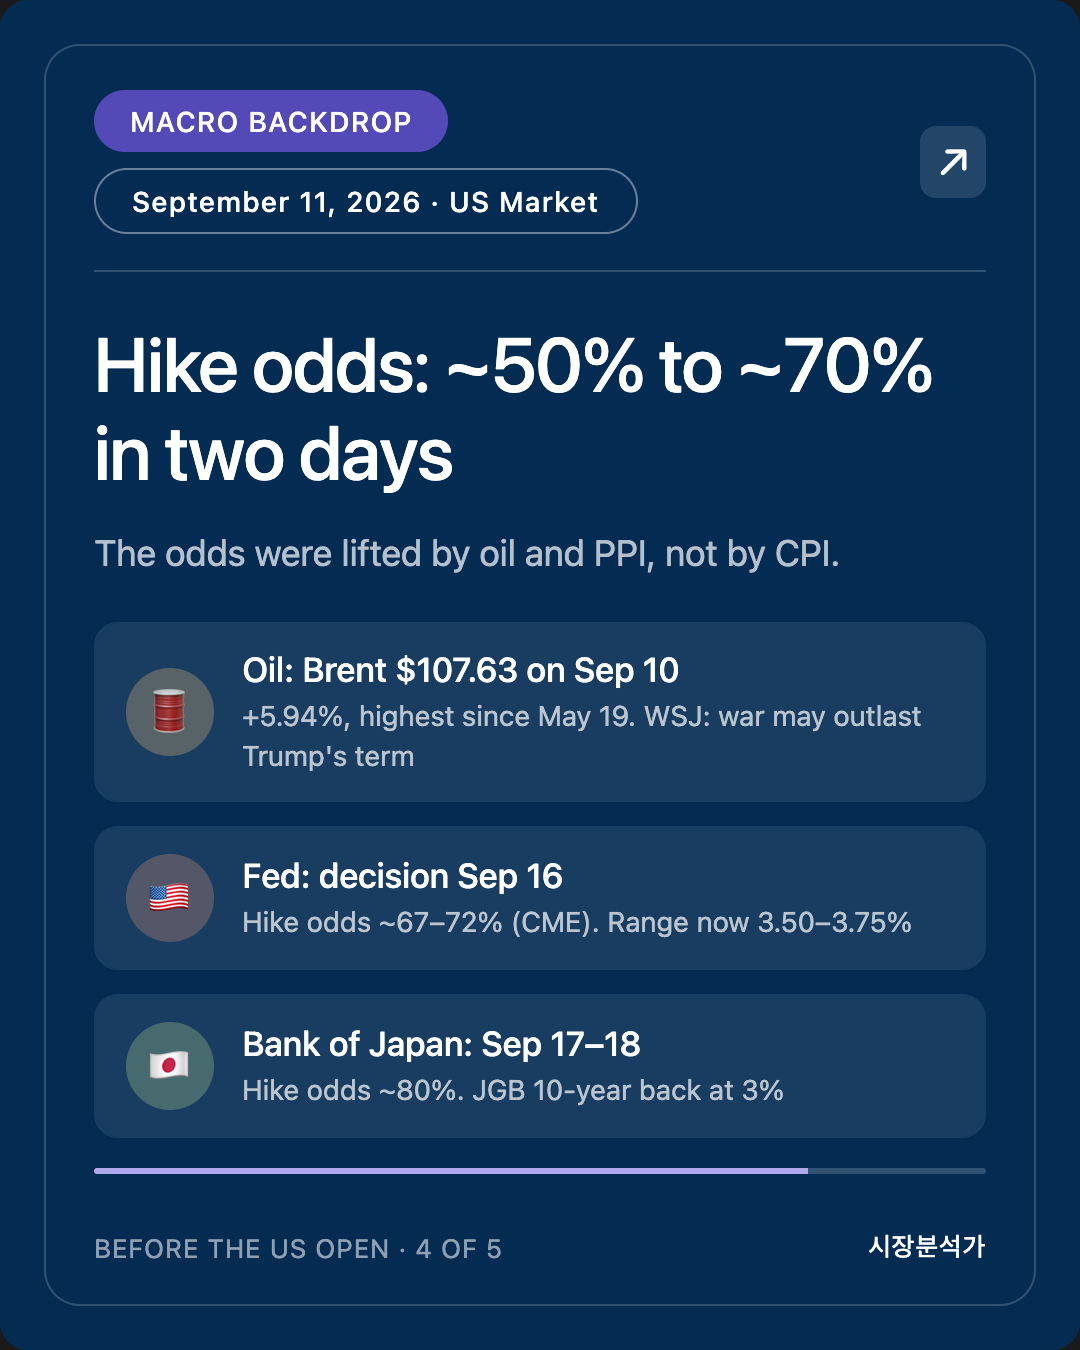
- Yesterday's PPI showed cool core inflation; today's CPI showed hot core inflation. The two gauges split, which leaves the Fed one fewer reason to call this a "temporary supply shock." CME-implied odds of a September hike stand at roughly 67–72%, up sharply from 48–60% two days ago.
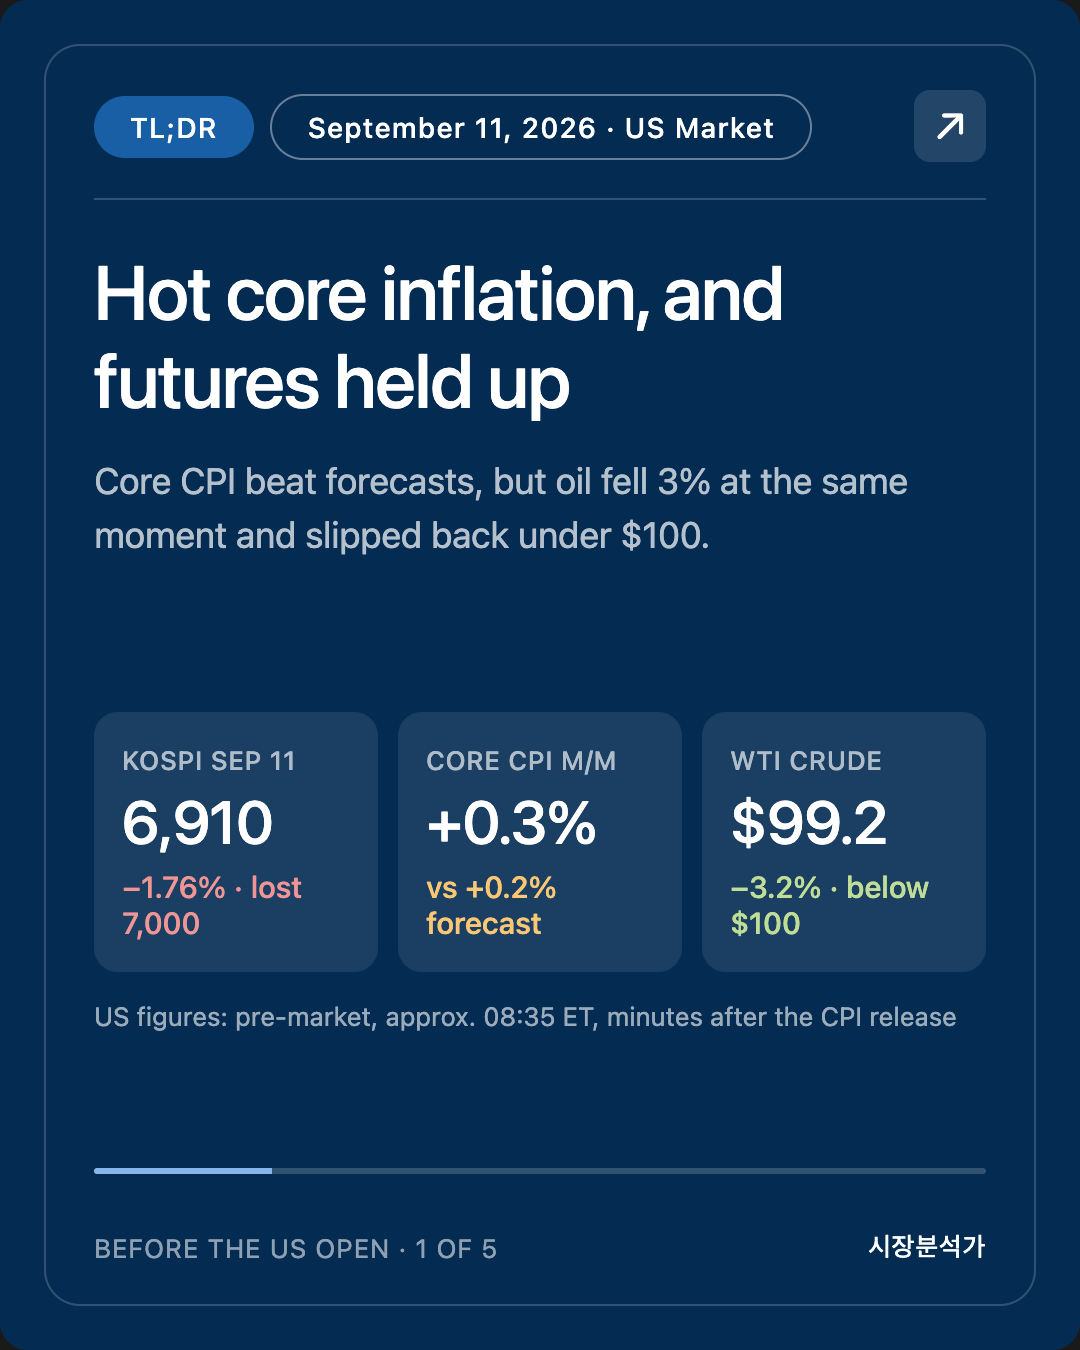
- Yet futures did not sell off [Observation]. Right after the print, S&P 500 futures were +0.6% and Nasdaq-100 futures +0.7%. At the same time WTI fell to $99.18 (−3.2%), snapping an eight-session winning streak. The hike was already ~70% priced; what actually moved today was oil.
- Korea's KOSPI lost 7,000 — closing at 6,909.91 (−1.76%). It failed the fourth test this report set yesterday ("Can the index hold 7,000 if foreigners keep selling?"). Foreign investors sold ₩2.29 trillion, and domestic institutions — yesterday's buyers — flipped to selling ₩1.22 trillion. Samsung Electronics fell 3.53%, SK Hynix 2.21%.
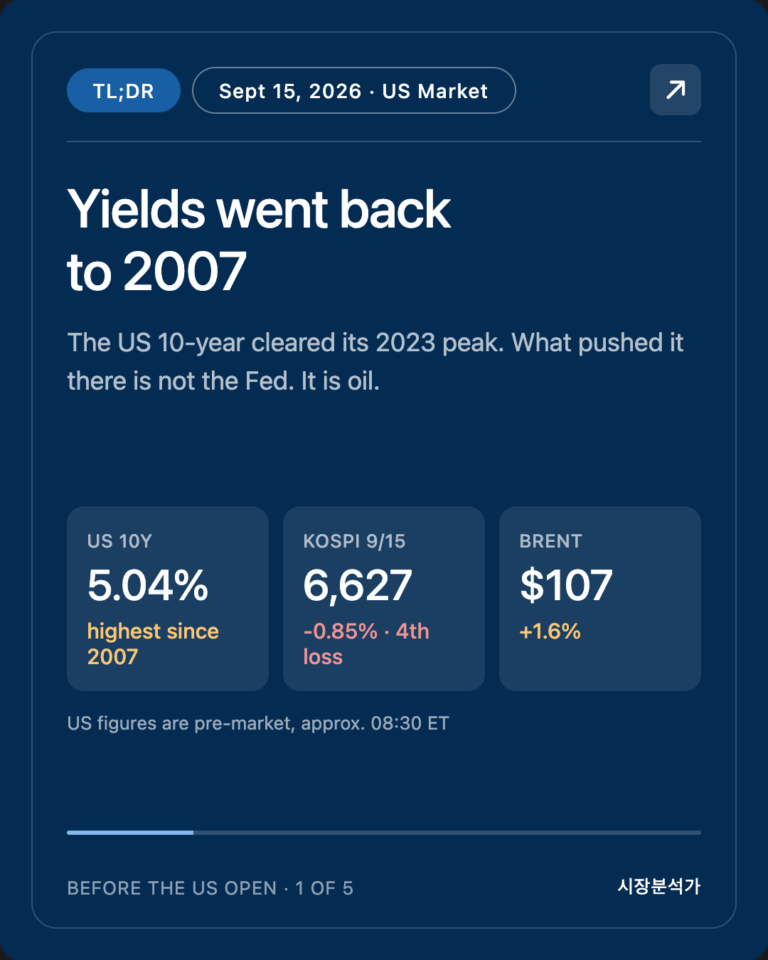
- Chips led the selling across Asia. Japan's Nikkei fell 1.93% to 64,011.34 (lowest since Aug 4); Taiwan dropped 1.61%. Japan's 10-year yield climbed back to 3%. The overnight US moves — 10-year at 4.94%, 30-year above 5.37%, Brent at $107.63 (+5.94%) — landed squarely on Asia's morning.
This is Mr. Can. Here is the September 11, 2026 brief ahead of the US market open.
Written: 2026-09-11, 05:55 PDT (Seoul: Sept 11, 21:55 KST)
Covers: Korea/Asia Sept 11 close + Europe Sept 11 morning + US Sept 10 final close + US Sept 11 pre-market (minutes after CPI, approx. 08:35 ET)
✅ This edition ran on schedule — slotted for 05:30 PDT, started 05:35 PDT. It is the first on-time morning run in three days, after late starts on Sept 9 and Sept 10.
US August CPI was released at 08:30 ET (05:30 PDT), and this report was written on pre-market prices roughly 5–10 minutes later. Things can still move before the 09:30 ET open. Immediate market reactions are tagged [Observation].
Last night's Before the Korean Open edition did not run. So this report also carries the US Sept 10 final closes and corrects yesterday morning's intraday figures — see Corrections below.
SEO Intro
US consumer prices for August came out this morning. Headline CPI rose 0.4% month-on-month, as expected. Core CPI rose 0.3%, hotter than the 0.2% forecast.
Yesterday this report said: "If only core CPI runs hot, it means yesterday's PPI was the exception, and the case for a hike hardens. The two inflation gauges disagreeing is the harder outcome for markets." That is exactly what we got.
Yet right after the release, US stock index futures held gains of 0.6–0.7%. At the same moment oil fell more than 3%, pulling WTI crude back under $100 a barrel.
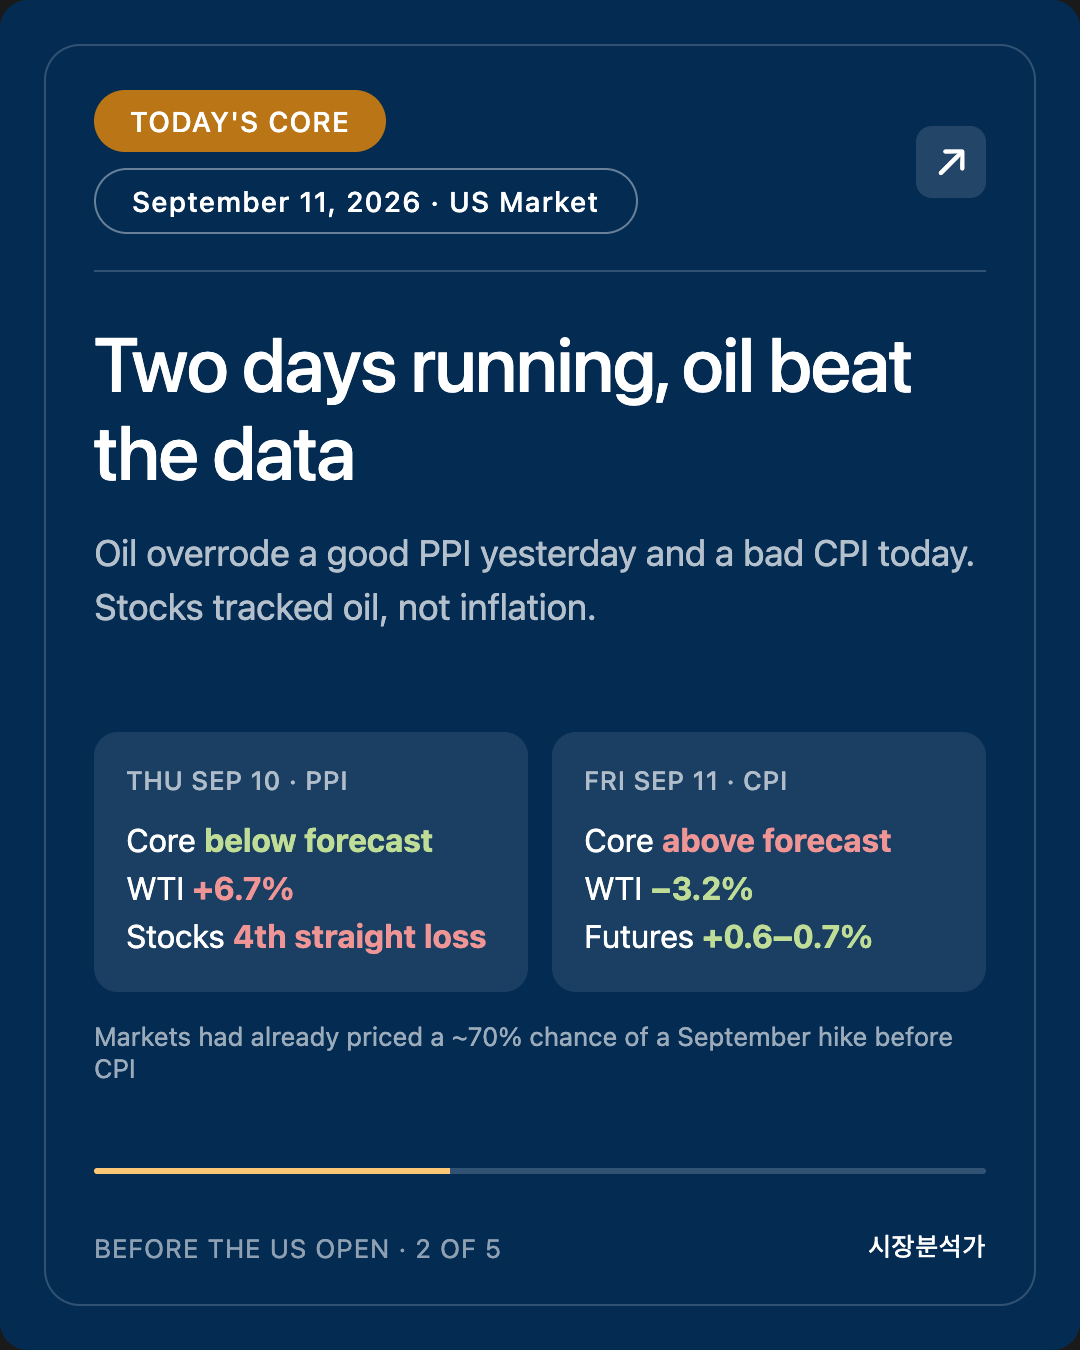
Yesterday oil overpowered good data. Today oil papered over bad data. For two days running, the thing moving markets has not been inflation prints. It has been the oil price.
1. Today's Core — Hot Core, Cooling Oil
[Fact] US August Consumer Price Index (released Sept 11, 08:30 ET, BLS)
- Gasoline +3.9% m/m — more than one-third of the headline increase
- Energy +2.1% m/m, +16.3% y/y (gasoline +27.4% y/y)
- Shelter +0.3%, food +0.1%
[Fact] Markets right after the release (approx. 08:35 ET, pre-market)
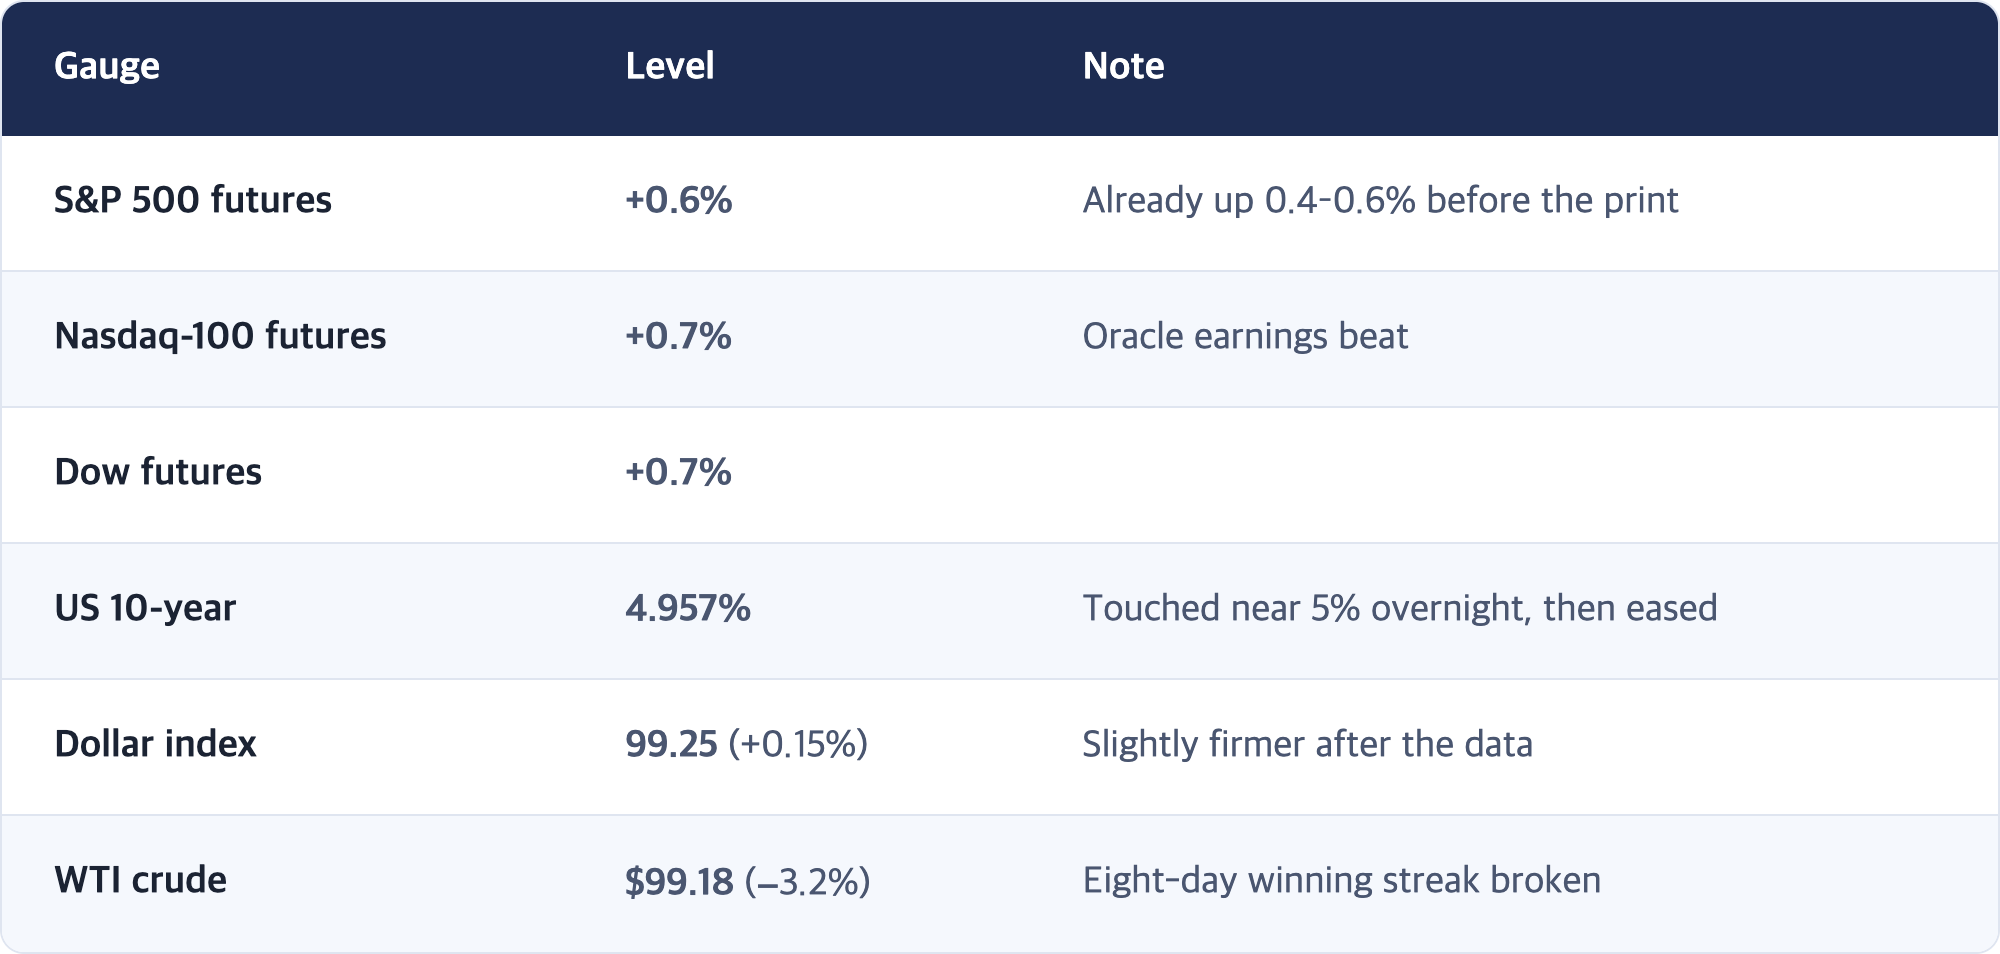
[Analysis] Which row of the table did we land on?
This is the table the Sept 9 report drew, repeated yesterday:
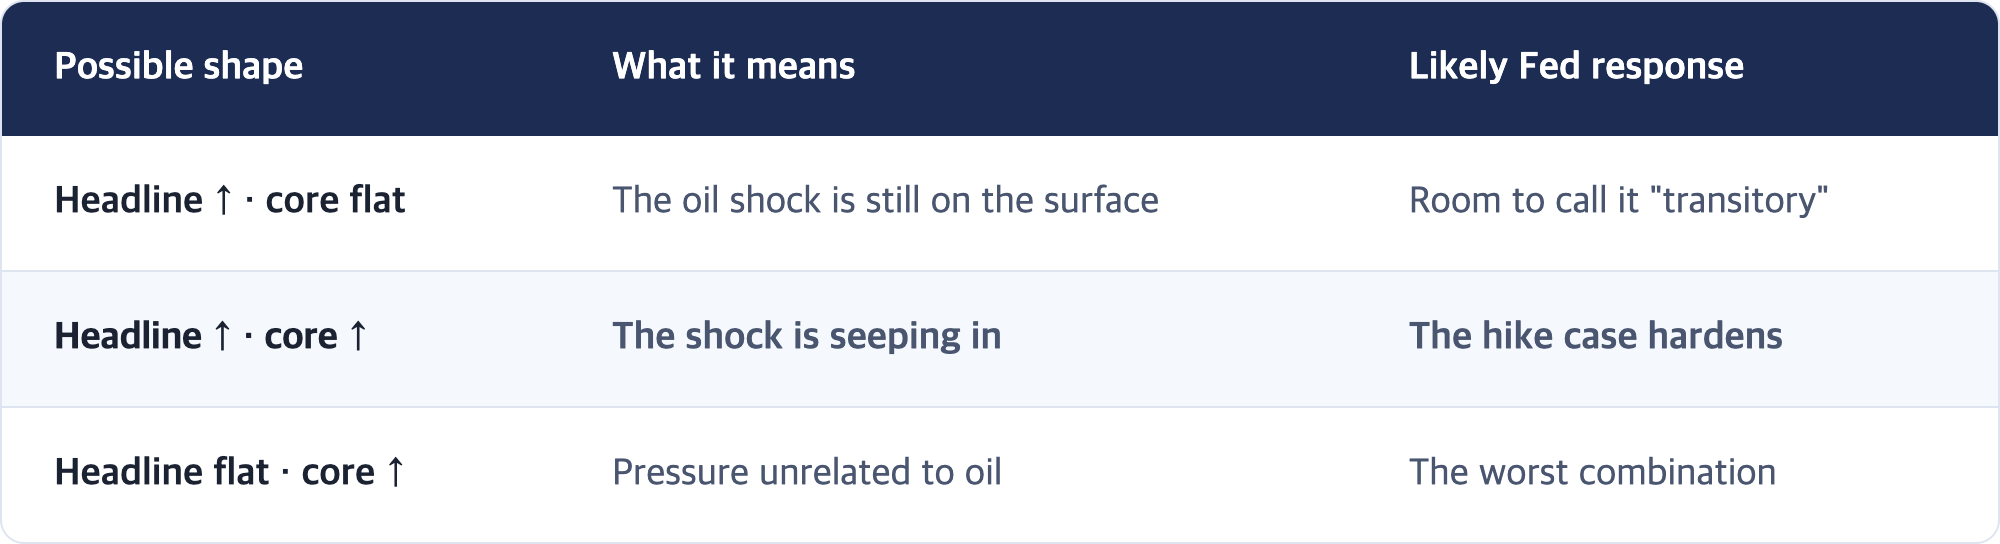
Yesterday's PPI sat on the first row. Today's CPI sits on the second. A 0.3% core print is not a knockout blow, but it weakens the Fed's ability to treat this oil shock as a surface-level event.
One honest caveat: core inflation year-on-year actually eased, from 2.5% to 2.4%. One hot month does not make a trend. Today's number says the shock may be starting to seep in — it does not confirm it.
🔴 [Analysis] So why didn't futures fall?
Core came in hot. By the textbook, stocks should drop. Instead, futures held their gains. Two reasons.
First, the hike was already in the price. The day before, the CME FedWatch tool put September hike odds at about 70–72%. Markets had already made "hike next week" the base case. A 0.3% core print confirmed that scenario more than it added to it. Some tallies even show odds slipping to around two-in-three after the release.
Second, a bigger variable moved the other way at the same moment. WTI fell more than 3% and dropped back under $100 — its first pullback after gaining more than 12% this week. Oil has been driving yields and stocks for two days; on a day oil takes a breather, one inflation print does not flip the direction.
Put yesterday and today side by side, and the pattern is stark:
![Thu Sep 10 · PPI · Fri Sep 11 · CPI / Core result · Below forecast (good) · Above forecast (bad) / Oil that day · WTI +6.7% ($102.48) · WTI −3.2% ($99.18) / Stocks · Down (4th day) · Futures up [Observation]](https://wecansurvive.ca/wp-content/uploads/2026/09/tbl_4-23.png)
For two days, the quality of the data and the direction of stocks have disagreed — while oil and stocks have moved in opposite directions both times. Yesterday this report called Sept 10 "the day prices beat the data." Today confirmed it again, from the other side.
[Analysis] So was today's CPI irrelevant?
No. CPI matters less for today's stock price than for next week's Fed decision. Futures holding up on the back of cheaper oil does not erase a 0.3% core print. When Fed officials walk into next week's meeting, it is this number they will be looking at, not today's futures.
And oil falling today is not the same as the oil shock being over. Today's drop follows five straight gains in Brent and eight in WTI; it looks like a technical pullback, and Middle East news does not keep a calendar. For today's relief to last into Monday, oil needs a quiet weekend.
2. Korea and Asia Close (Sept 11 KST)
[Fact] Korea Sept 11 close
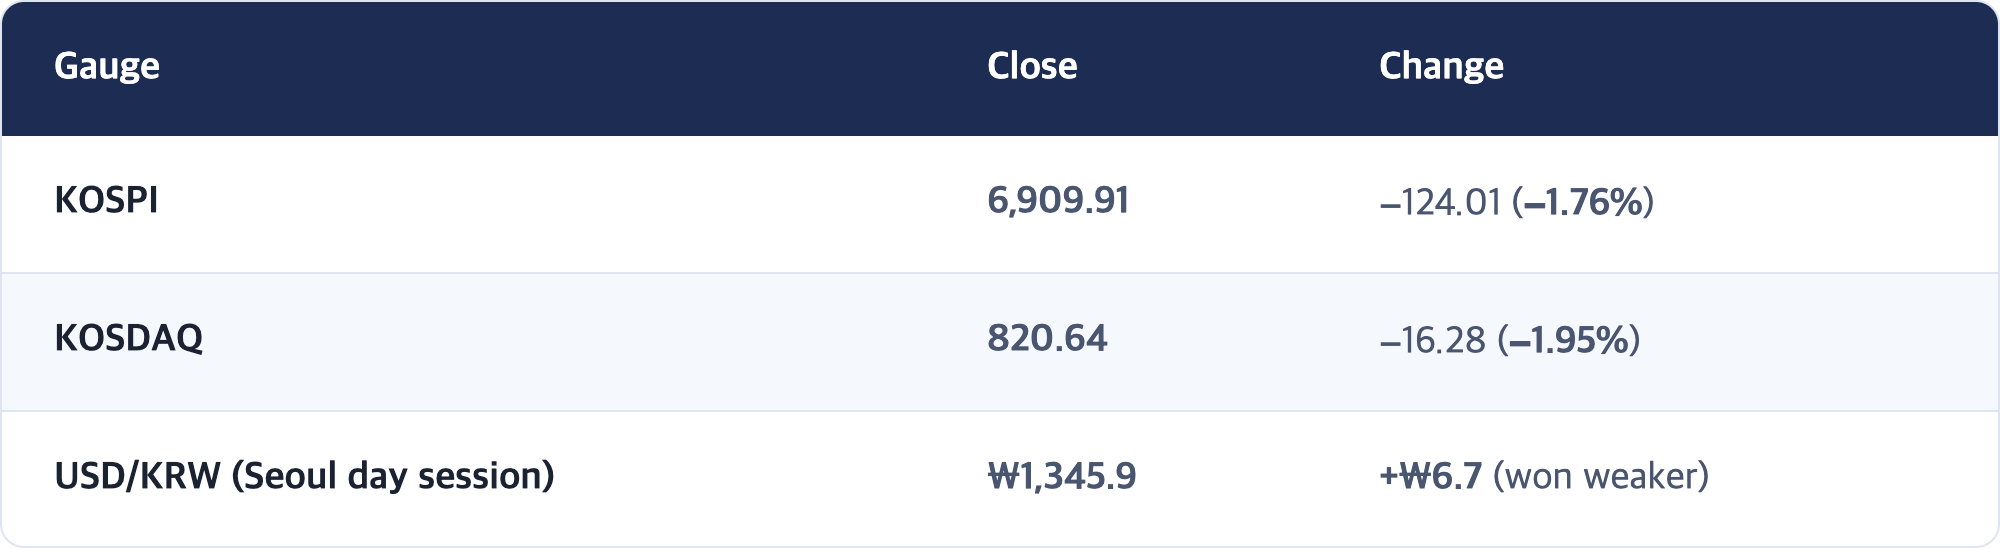
The KOSPI opened sharply lower at 6,802.50 (−3.29%) and clawed back part of the loss late in the session. 369 stocks rose, 475 fell; turnover ₩19.39 trillion.
[Fact] Investor flows (KOSPI)
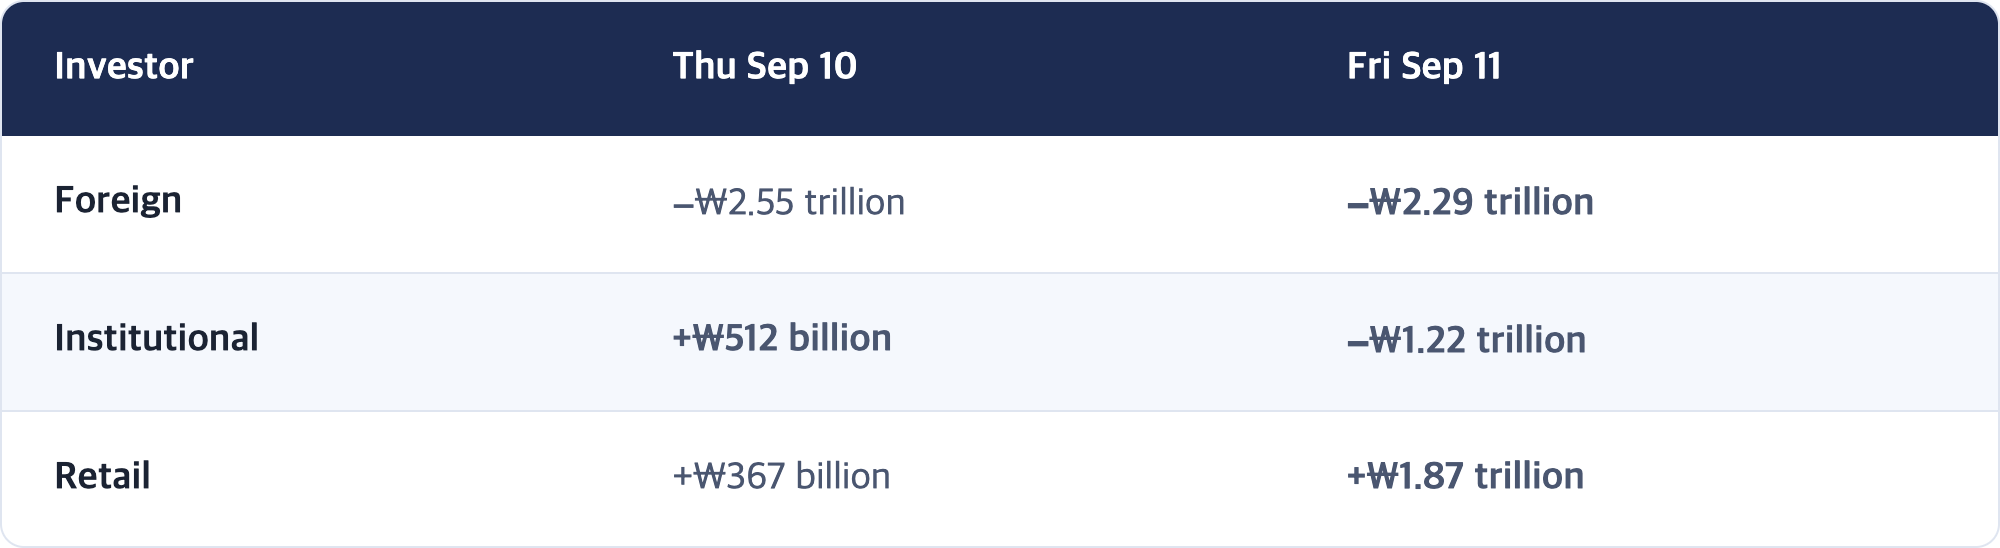
"Other corporations" — in recent weeks mostly company share buybacks — were tallied at about +₩1.65 trillion (single source; see Corrections).
[Fact] Sectors and names
- Down: electrical & electronics −2.66%, manufacturing −2.21%, medical & precision −2.18%
- Samsung Electronics ₩259,500 (−3.53%), SK Hynix ₩1,812,000 (−2.21%), SK Square −4.05%
- Up: construction +1.90%, insurance +1.56%, KB Financial +2.60%, HD Hyundai Heavy +5.62%
- KB Financial was the only gainer among the ten largest companies
[Analysis] Grading yesterday's checkpoints
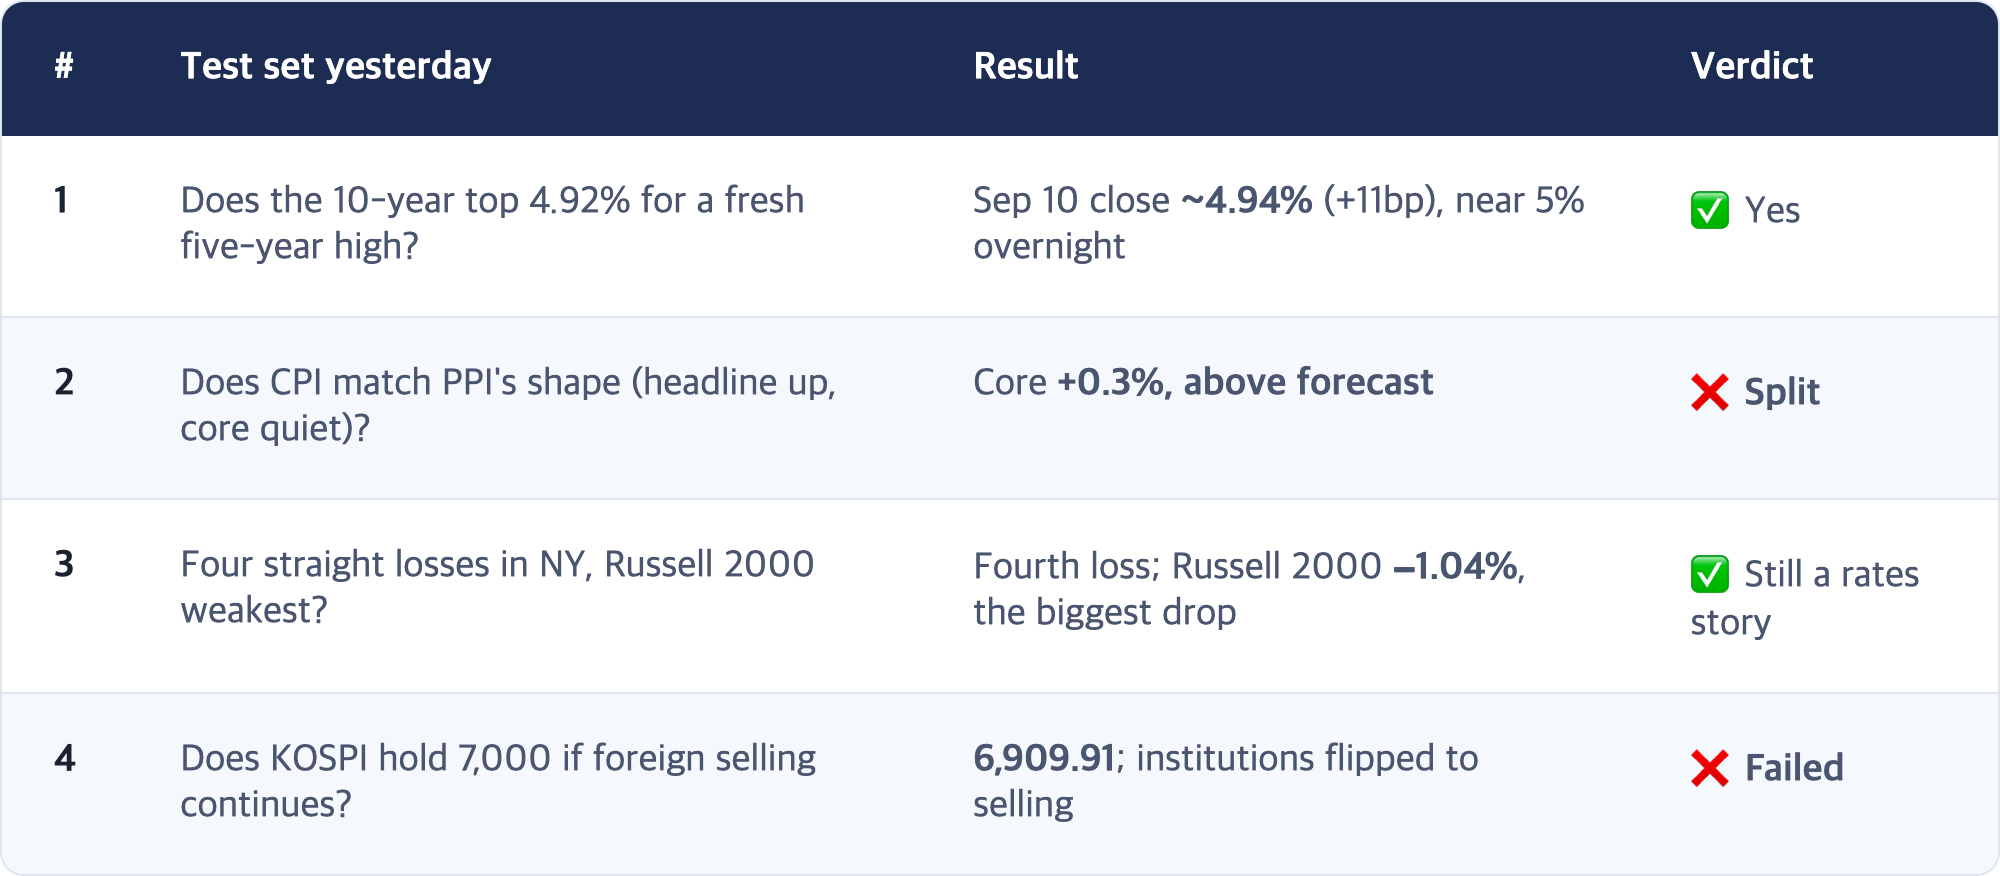
Two went as expected, two went the other way — and the two that flipped are the more important ones.
🔴 [Analysis] One of the hands holding up 7,000 let go
Yesterday we wrote: "If the index holds with the same structure tomorrow, that is a second piece of evidence of a thick floor. If it breaks, today was just a one-off dip-buying session."
It broke — and the way it broke is specific. Foreign selling was about the same size as the day before (₩2.55tn → ₩2.29tn). What changed was the institutions. They absorbed ₩512 billion yesterday; today they sold ₩1.22 trillion. When the number of hands catching foreign selling went from two to one, the index slipped below 7,000.
Retail (+₩1.87 trillion) and "other corporations" (likely buybacks) took the rest — a return to the "buybacks holding up the index" structure we saw several times from late August into early September. The buyback figure comes from a single source, so we stop short of concluding it.
Foreigners have now sold about ₩4.8 trillion in two days. Section 3 looks at what that selling is about — US rates and semiconductors point the same way.
[Fact] Asia Sept 11 close
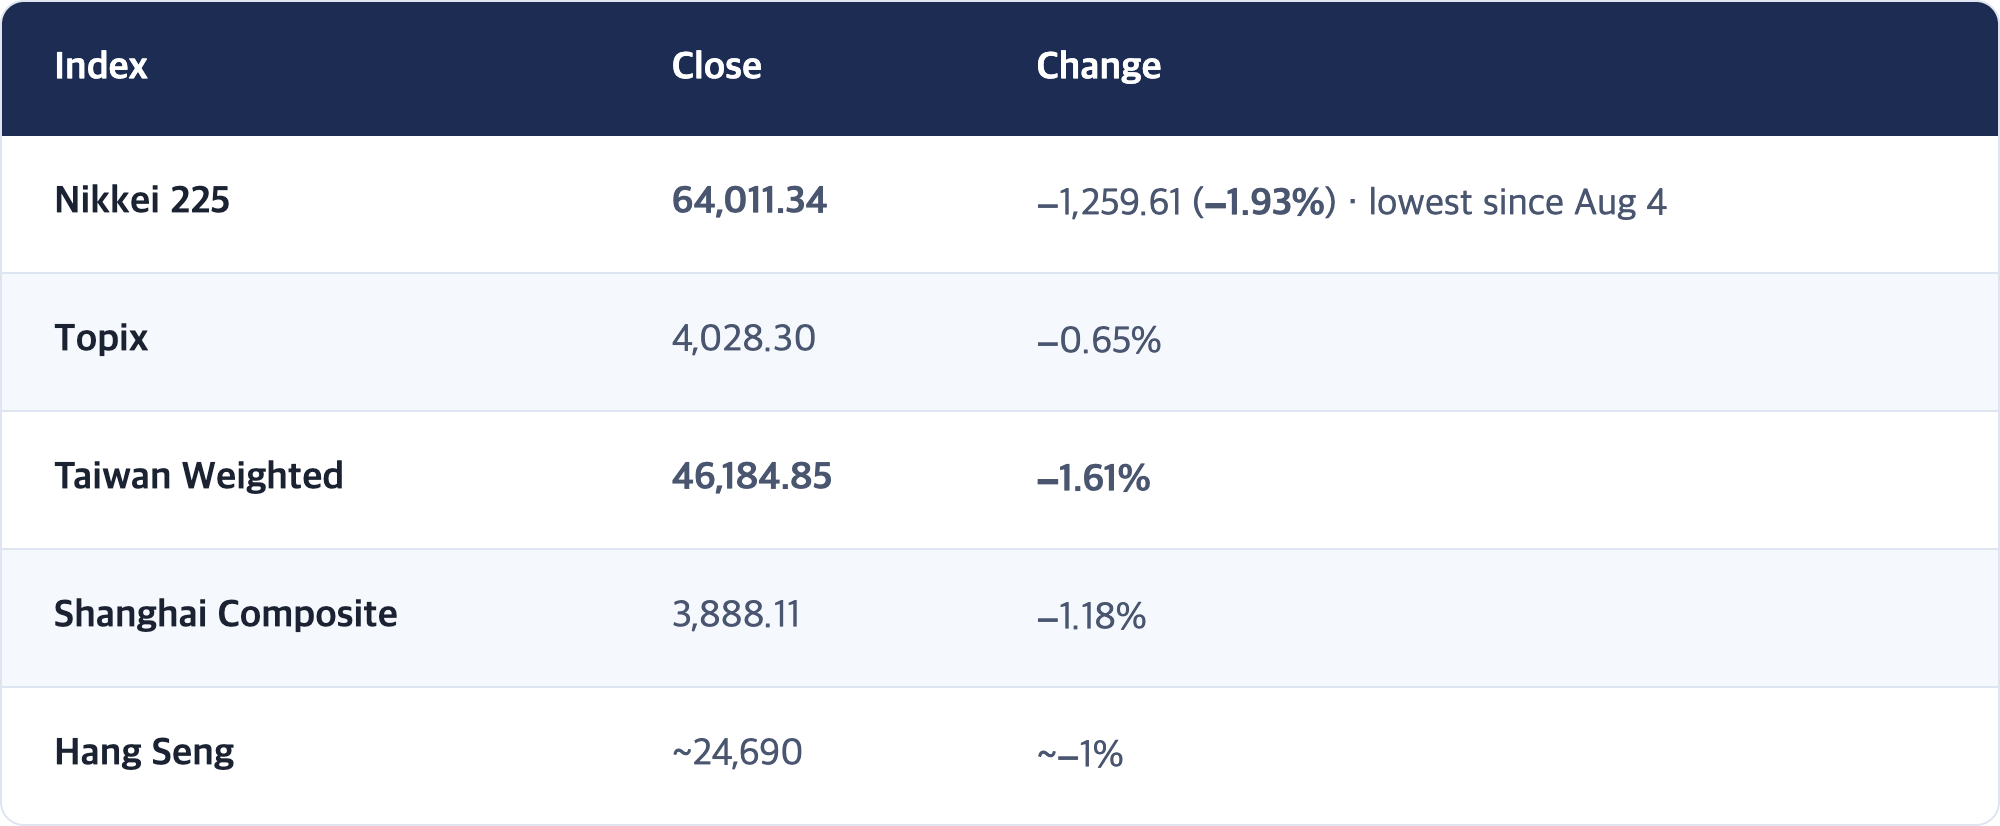
Tokyo's biggest losers were Resonac (−10.68%) and Kioxia (−6.99%, a memory-chip maker); shipping and insurers rose. Japan's 10-year government bond yield climbed back to 3%.
[Analysis] Nikkei −1.93% vs Topix −0.65%
The Nikkei fell three times as much as the Topix. The Nikkei is price-weighted and heavy in a handful of big tech names; the Topix covers the whole market by market cap. In Tokyo, "AI and chips" fell far more than "the market."
Korea looked the same: electronics −2.66% while construction, insurance and banks rose. Taiwan is also a chip-heavy market. Asia's drop today was not broad selling — it was selling concentrated in one sector. Section 3 explains why.
3. The US Variable (Sept 10 close → Sept 11 pre-market)
[Fact] US Thursday Sept 10 final close
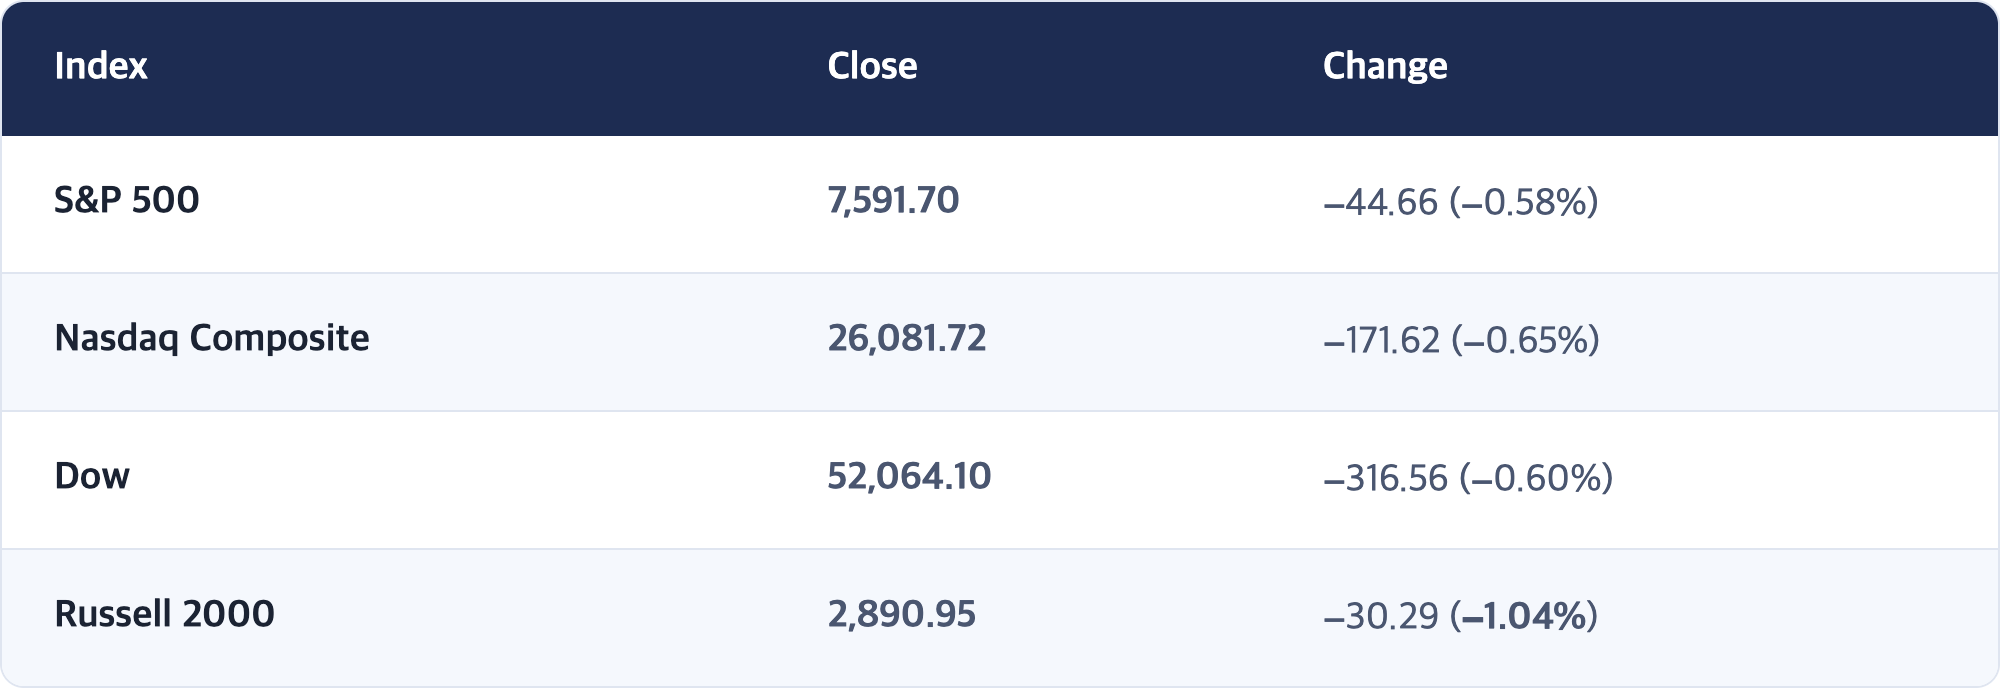
Four straight losses. Week to date (through Thursday): S&P 500 −1.6%, Dow −2.5%, Nasdaq −1.6%, Russell 2000 −2.8%.
[Fact] Bonds and commodities, Sept 10 close
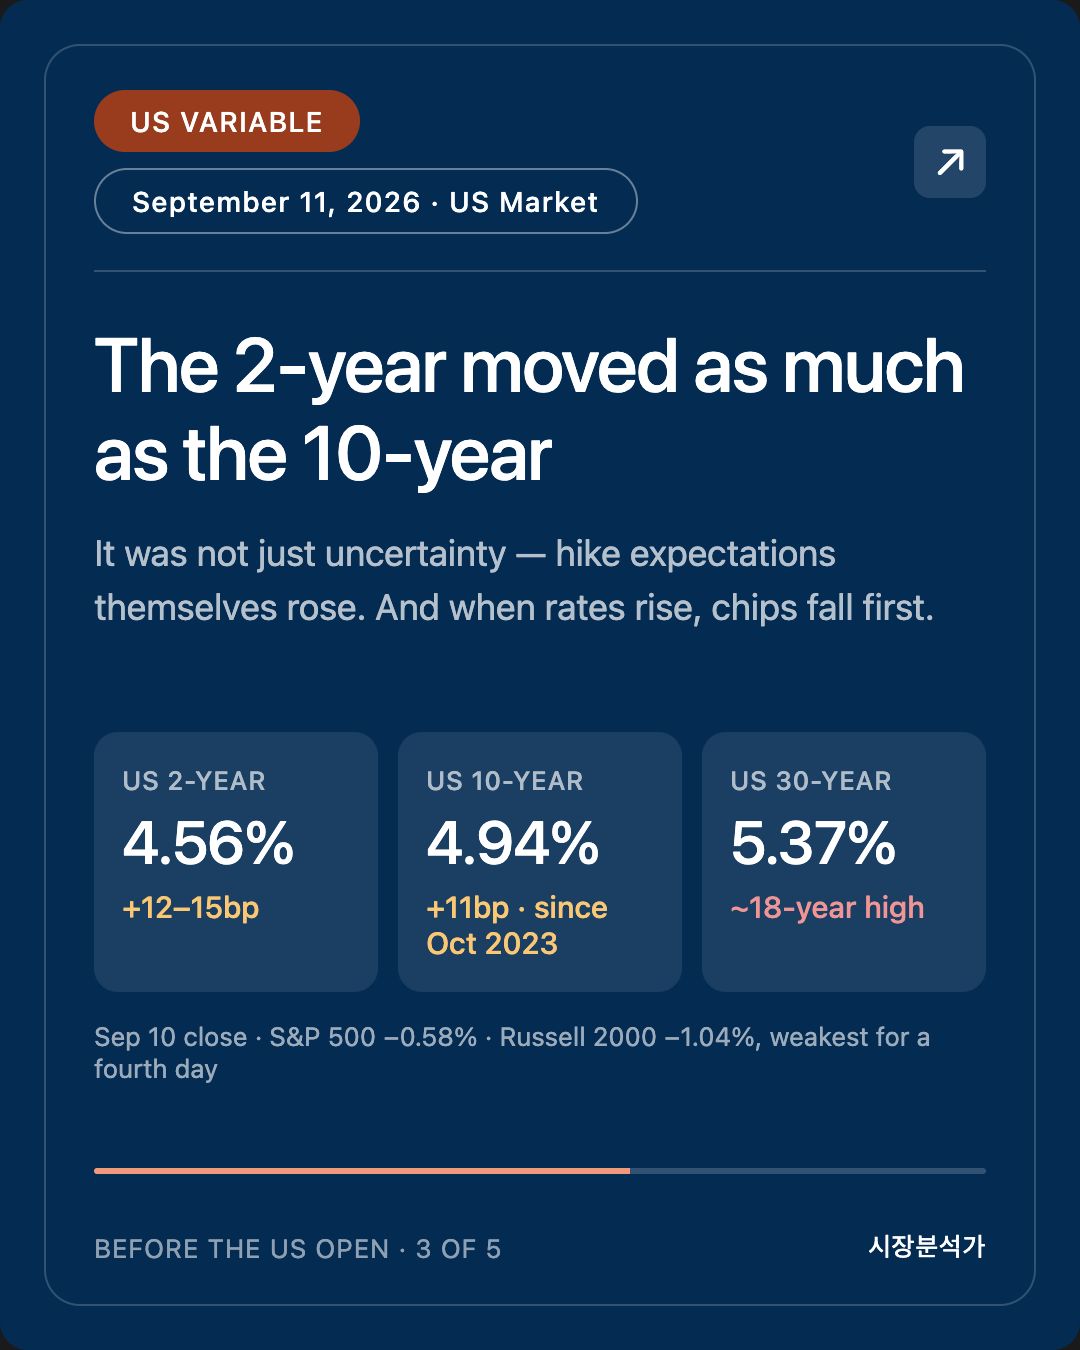
- US 10-year ~4.94% (+11bp) · highest since October 2023
- US 2-year ~4.56% (+12–15bp) · highest in over two years
- US 30-year above 5.37% · roughly an 18-year high
- WTI $102.48 (+6.7%) · Brent $107.63 (+5.94%) · both highest since May 19
- US retail diesel topped $6 a gallon for the first time ever
🔴 [Analysis] The 2-year rose as much as the 10-year
Yesterday's study note explained the jump in the 10-year yield as a rise in the term premium — the extra return investors demand for tying money up over a long, uncertain horizon. With closing prices in hand, that was only half right.
The 2-year yield is the most direct read on where markets think the Fed's policy rate is headed. It rose 12–15bp, as much as or more than the 10-year (11bp). So Thursday wasn't only about long-run uncertainty — expectations for a hike next week rose too. In the terms of yesterday's note: it was not just the "deposit" (term premium) that went up, but the "rent" (expected short-term rates) as well.
That difference matters. A term-premium spike can calm down if the Fed simply signals patience. A rise in hike expectations only calms down if the Fed actually hikes — or clearly says it won't. Next week's decision just got heavier.
[Analysis] Why chips fall first when rates rise
The chip selloff across Asia ties directly to these yields. A big share of a semiconductor or AI company's share price is the present value of profits far in the future. When the discount rate (interest rates) rises, the further out the profits, the more their present value shrinks. Sectors that earn their money now — construction, insurance, banks — are less exposed, and for insurers and banks higher rates can even help earnings.
KB Financial rising while Samsung fell in Seoul, and insurers rising while Kioxia fell in Tokyo, are the same story. It is less a signal that growth is cracking than a signal that money is getting more expensive. Checkpoint 3 — the Russell 2000 staying the weakest — points the same way.
[Fact] Other pre-market drivers, Sept 11
- Oracle earnings: beat estimates; remaining performance obligations of $664 billion; more than $30 billion in new AI cloud contracts booked in the quarter; fiscal 2027 EPS guidance raised to $8.10. Shares up pre-market
- Why it matters beyond one stock: it signals that hyperscaler and cloud AI spending is not slowing, which ties directly to memory-chip demand. Rates press down on the chip sector's denominator; AI spending props up the numerator. Nasdaq futures leading today suggests that, for one morning, the balance tipped toward the numerator [Observation]
[Fact] Geopolitics
- The Wall Street Journal reported that senior White House advisers discussed with President Trump the possibility that the Iran conflict could outlast his current term
- Iran-aligned Houthi rebels in Yemen seized the Red Sea port city of Mocha, and Iran resumed ballistic-missile production (as reported by Money Today)
- Oil is pulling back today on what looks like a technical correction, but WTI is still up more than 12% on the week — its biggest weekly gain since mid-July
4. Macro Backdrop — Next Week: the Fed and the Bank of Japan
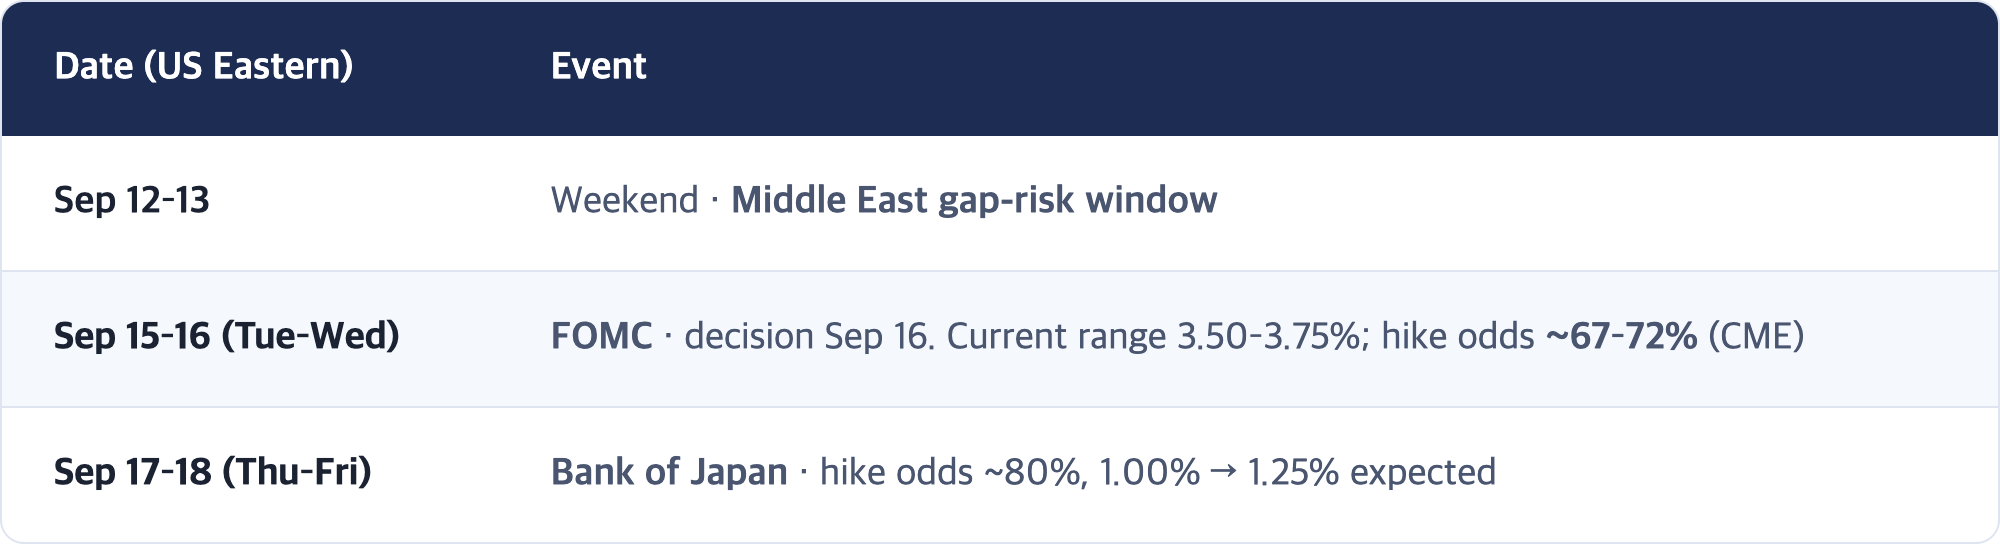
[Fact] Next week's calendar
[Fact] Rates, currencies, commodities (Sept 11 morning)
- JGB 10-year 3% (first time since Sep 2)
- USD/JPY 153–154 (Jiji noon fixing 154.38, about ¥1 weaker than the prior day)
- Gold (December futures) opened at $4,359.40, the lowest since Aug 6; $4,387 at 06:53 ET
- Bitcoin below $77,000, extending its slide from last week's $82,300 high
[Analysis] Why is gold falling during a war?
Conflict in the Middle East is escalating, yet gold is at a one-month low. It looks odd until you remember that gold pays no interest. When yields rise, the opportunity cost of holding gold rises too. Add a firmer dollar, and dollar-priced gold gets squeezed twice.
Right now the forces pushing gold down (rates, the dollar) are stronger than the one holding it up (geopolitics). It is the same big picture again: the strongest variable in markets this week is interest rates, and what pushed rates up was oil.
[Analysis] How fast the hike odds climbed
![When · September hike odds · Trigger / Sep 9 – Sep 10 morning · 48–60% (by source) · Oil crosses $100 / Sep 10 afternoon · ~63% · PPI + oil spike / Sep 11, before CPI · ~70–72% · 2-year surges overnight / Sep 11, after CPI · ~67–70% [Observation] · Edged lower despite hot core](https://wecansurvive.ca/wp-content/uploads/2026/09/tbl_11-15.png)
This table explains in one glance why futures held up. What drove the odds higher was not CPI, but the oil and PPI in the two days before it. By the time CPI landed, the odds had already climbed about as far as they were going to.
[Analysis] Korea's market commentators and the current phase
The four Korean market commentators this report tracks — Kwak Sang-jun, Park Si-dong, Lee Kwang-soo and Lee Sun-yup — broadly see semiconductors as the core growth engine of the Korean market. Oracle's AI spending numbers today speak to the numerator side of that view: earnings.
At the same time, chips being the biggest losers in Korea, Japan and Taiwan today is a denominator story: rates. The two do not contradict each other. Viewed through Lee Sun-yup's long-standing argument that "flows and leverage, not headlines, drive sharp selloffs," two days of ₩4.8 trillion in foreign selling plus institutions flipping to sellers can be read as flows responding to a changing rate environment rather than a change in earnings views. That is still interpretation — what foreign investors are really reacting to should become clearer after next week's Fed decision.
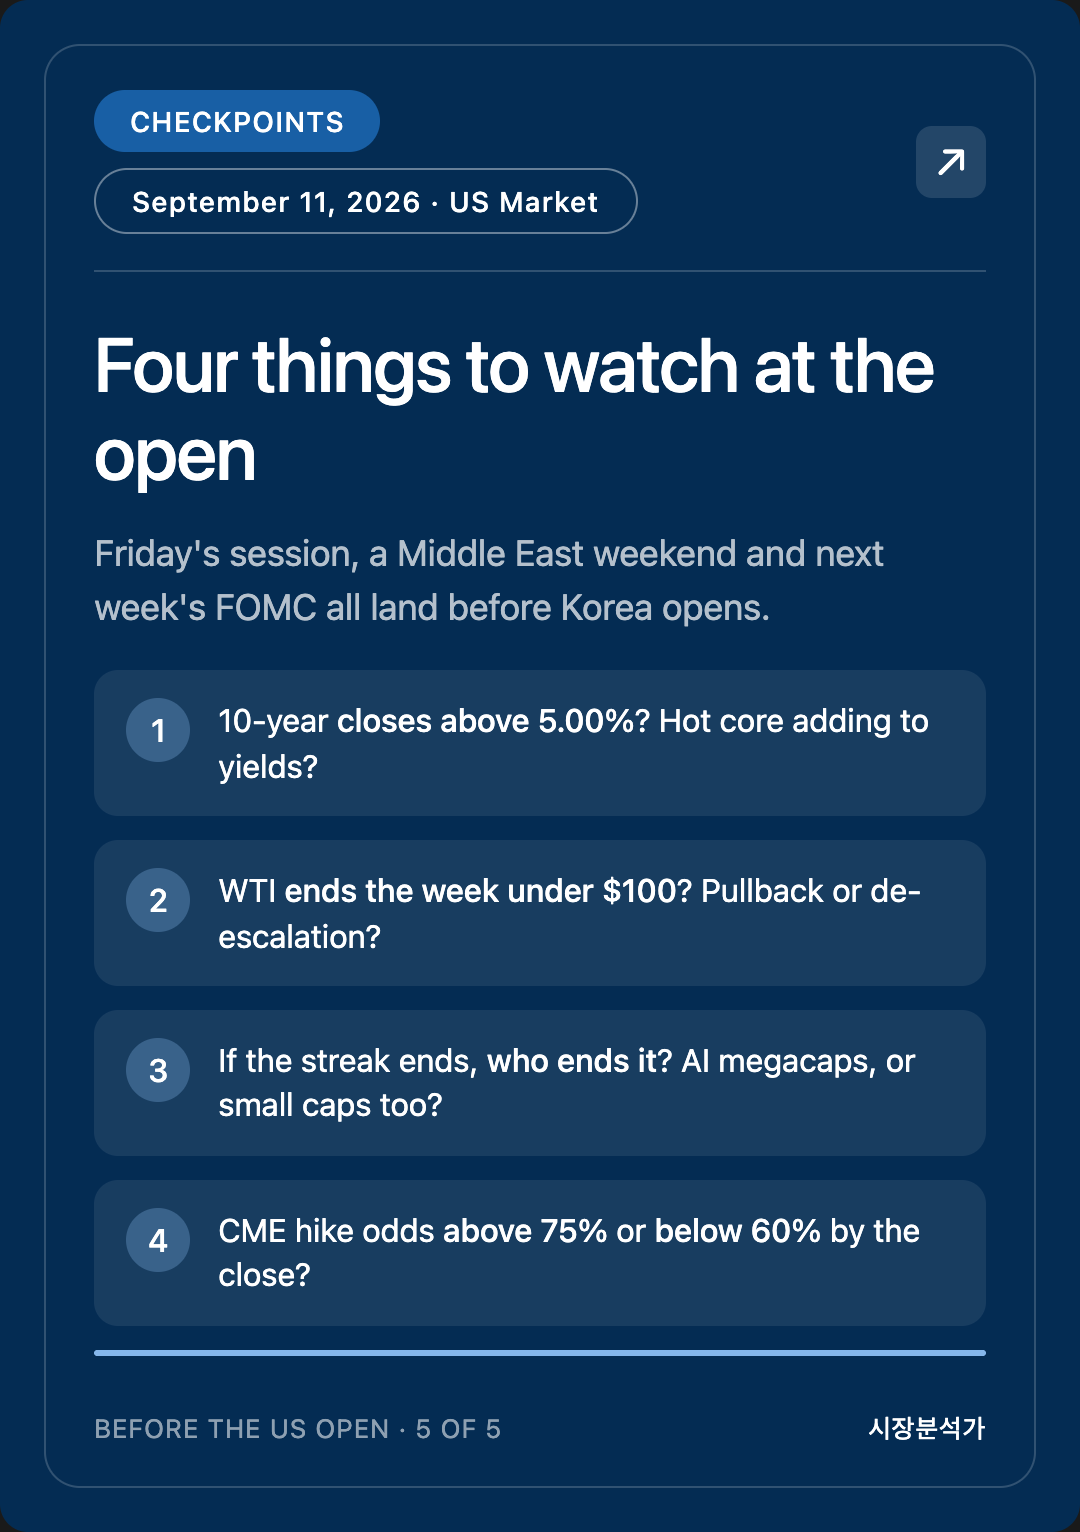
5. Checkpoints — Four Things to Watch at the US Open
1. Does the 10-year close above 5.00%?
Axis: is the bond market reading hot core as a done-deal hike?
It flirted with 5% overnight and sits around 4.95% after CPI. A close above 5.00% means the 0.3% core print added something new to yields; a drop below 4.90% means today's CPI merely confirmed what was already priced.
2. Does WTI finish the week below $100?
Axis: is today's drop a technical pullback or the start of de-escalation?
A close under $100 makes Monday's start lighter, barring weekend news; a move back above $100 removes the reason futures are up today. Remember that the weekend is when oil can gap the most.
3. If the five-day losing streak ends, who ends it?
Axis: is the bounce a handful of AI megacaps, or the broad market?
If the Nasdaq (Oracle, AI) rises while the Russell 2000 stays weak, we are still in a rates regime. If the Russell 2000 outpaces large caps, rate pressure is easing. Through Thursday, the Russell 2000 was the weakest index this week at −2.8%.
4. Where do CME FedWatch September hike odds end the week?
Axis: the market's last reference point before the decision.
Currently about 67–72%. Above 75% means the market sees a hike as essentially certain; below 60% means today's oil drop has shaken the hike case itself. Because this figure has varied widely across sources this week, from the next edition we will quote CME FedWatch alone.
[Analysis] On Monday's Korean session
Korea gave up 7,000 today and foreigners have sold more than ₩2 trillion two days in a row. Friday's US session, a weekend in the Middle East and the FOMC two days later all stack up in front of Monday's open in Seoul. This is not a directional call — only a note that the window for new information is wider than usual. On Monday, the thing to watch is less the index level than whether institutions go back to being buyers.
📖 Study Note — Why a Worse-than-Expected Number Doesn't Always Sink Stocks: Consensus vs. Price
This morning was a textbook example, so let's unpack it.
The concept — there are two kinds of "expected"
When the news says "expected +0.2%," that expectation is the median forecast of economists — the consensus. It comes from a survey.
But markets carry a second expectation: the one already baked into prices. It is the shape of what people have put money on — in rate futures, stocks and currencies. The two often differ.
Today they did. Consensus had core at +0.2%, and prediction markets put only a 28% chance on anything above +0.2%. On paper, +0.3% was a surprise. But rate futures were already pricing a September hike at over 70%. Economists expected core to stay quiet; people with money on the line had already bet on "hike anyway."
Markets react to surprises relative to price, not relative to consensus. A 0.3% print was worse than consensus, but not bad enough to shake the ~70% hike already in the price.
An analogy — the weather forecast and the umbrella shop
Say the weather service forecasts a 30% chance of rain tomorrow. That is the consensus.
But skies have been heavy all week, and people have already bought umbrellas. The corner store is sold out. That is the expectation already in the price.
If it rains the next day, the forecast was wrong — but umbrella sales barely move, because everyone who wanted one already has one. Today's 0.3% core was the rain; this week's oil spike and PPI were the heavy skies.
Real examples — same shape, opposite reactions
Two scenes from this very week make the idea concrete:
- Sept 10 PPI: core came in better than consensus. But oil at $100 was flowing into prices, and hike odds rose further that day. A good number couldn't pull prices back.
- Sept 11 CPI: core came in worse than consensus. But a 70% hike was already priced, and oil fell 3% at the same moment. A bad number couldn't push prices further.
On both days the data missed consensus, but what moved prices was how far the data landed from what prices already implied — and this week, prices were being set by oil.
How to use this
Next time you see "the number came in better (or worse) than expected, and the market went the other way," check two things first:
- What was the market already betting on the day before? For interest rates, the CME FedWatch hike/cut odds are the easiest tool.
- Did another big variable move at the same time? This week, it was oil.
Those two checks explain most "strange" reactions. And when a reaction still doesn't make sense after both — that is the day genuinely new information has arrived.
⚠️ Corrections and Open Items
1. ✅ Back on schedule after three days. This run started at 05:35 PDT (slot 05:30), the first on-time morning run after late starts on Sept 9 (3h 55m) and Sept 10 (1h 39m). Returning to schedule does not mean the cause is fixed, so the investigation stays open.
2. 🔴 The Sept 10 Before the Korean Open edition did not run. US Sept 10 closes are in Section 3, and yesterday morning's intraday figures are corrected here:
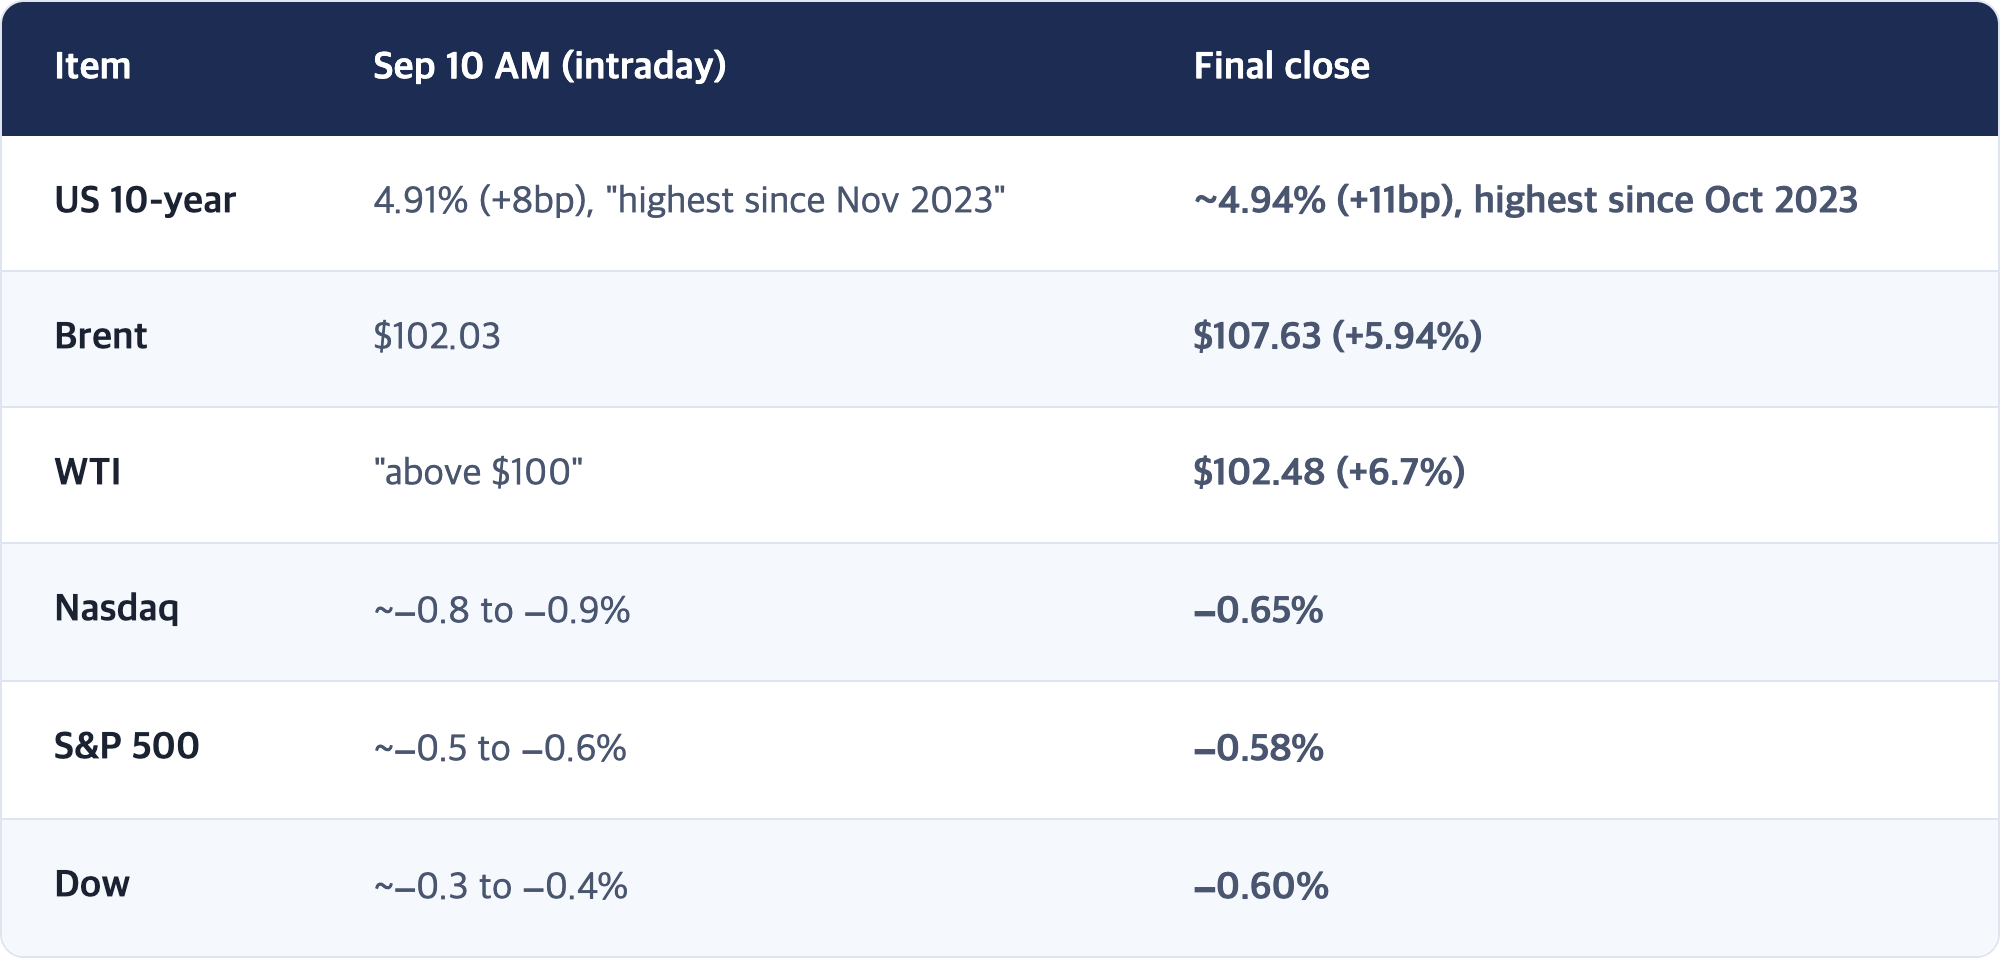
Brent closed more than $5 above the intraday level we reported — Thursday afternoon's oil rally was far bigger than it looked at the time of the morning edition.
3. 🔴 Partial correction to Sept 10's "good inflation data" framing. Core PPI month-on-month (+0.2%) did come in below the +0.3% forecast. But headline PPI year-on-year at 5.4% beat the 5.3% forecast (as cited by Money Today), and most major US outlets described Thursday's PPI as "hot." Yesterday's report called it "good data" based on one side of the release. The accurate description is "core m/m was cool, headline y/y was hot." The core interpretation — oil beat the data — stands; the claim that the data itself was uniformly good does not.
4. 🔴 Half-correction to Sept 10's study note (term premium). As Section 3 shows, the 2-year rose 12–15bp at the close, as much as or more than the 10-year (11bp). Thursday's rate move reflected rising Fed hike expectations as well as term premium. The concept in the note (the two components of long-term yields) is correct; its application to Thursday was only half right.
5. 🔴 KOSPI flow data differs by source. EBN (based on Korea Exchange data) and Opinion News agree: foreigners −₩2.29 trillion, institutions −₩1.22 trillion, retail +₩1.87 trillion. Financial News reported −₩2.46tn / −₩1.64tn / +₩2.43tn (likely a different cut-off time; unconfirmed). Businesskorea's figures had broken units and were excluded. We adopted EBN, where two sources agree. The other-corporations figure (~+₩1.65tn) comes from Opinion News alone.
6. SK Hynix Sept 10 close — a ₩5,000 gap. Yesterday we used ₩1,858,000; today's reported change (−₩41,000) implies ₩1,853,000. Today's close of ₩1,812,000 (−2.21%) is consistent across EBN, Opinion News and Businesskorea (Financial News alone has ₩1,813,000). The Sept 10 figure stays open. Samsung: ₩259,500 (−3.53%) adopted (Financial News alone has ₩259,000).
7. Nikkei close — sources differ. We adopted 64,011.34 (−1.93%), consistent across Money Today, Business Recorder and PANews. News On Japan reported 63,442 (−2.8%), which appears to be a morning-session figure; unconfirmed.
8. Shanghai Composite — sources differ. Money Today's 3,888.11 (−1.18%) and 24/7 Wall St.'s 3,862.73 (−1.82%) are both arithmetically consistent with the prior close, so we could not decide between them; Money Today is shown. The Hang Seng close could not be confirmed and is shown as "~−1%."
9. USD/JPY — sources differ. Jiji's noon rate of 154.38 (about ¥1 weaker) and News On Japan's "mid-153s" disagree; shown as 153–154.
10. FOMC odds. This edition's CME-based range is 67–72%, a narrower 5-point spread across sources (72.4% and ~70% before the print; "about two-in-three" after). We keep the range and will try to quote CME FedWatch alone from the next edition.
11. The PHLX Semiconductor Index (SOX) close could not be secured for a fourth straight edition. VIX was also not secured and is left out.
12. European closes not secured. Only STOXX 600 at 637.60 (+0.3%) as of 07:16 GMT Sept 11 was confirmed. It closed Thursday at a two-month low and is on track for its worst week since April. No DAX figure was secured.
13. All US Sept 11 figures are pre-market, minutes after the CPI release (approx. 08:35 ET). They may move further before the open.
🔗 Sources
- U.S. Bureau of Labor Statistics, "Consumer Price Index Summary: August 2026" (Sept 11, 2026, 08:30 ET)
- FXStreet, "US Consumer Price Index data expected to show annual core inflation ticking lower" (updated after release)
- Investing.com, "U.S. stock futures steady with CPI on tap; Oracle firms on strong earnings" (as of 08:35 ET)
- ts2.tech, "Dow Futures Rise 233 Points Before CPI as Oil Drops 1.4%"
- TheStreet, "Stock Market Today (Sept. 11, 2026): Nasdaq futures edge higher ahead of key inflation report"
- ABC News (AP), "How major US stock indexes fared Thursday 9/10/2026"
- Yahoo Finance, "CPI Data Prediction Market Preview: Traders Brace for a Razor-Thin Call"
- Yahoo Finance / 24/7 Wall St., "Tomorrow's CPI Report Could Send Rate-Hike Odds Even Higher"
- Yahoo Finance, "Gold price today, Friday, September 11, 2026"
- CNBC, "Oil prices fall sharply after double-digit weekly gains above $100"
- Trading Economics, Brent and WTI, Sept 11
- EBN, KOSPI close data (Sept 11)
- Opinion News, KOSPI close and investor flows (Sept 11)
- Financial News, KOSPI close (flow comparison)
- Businesskorea, "[Market Close] KOSPI falls below 7,000 to 6,909.91" (FX and stocks)
- Asia Economy, KOSPI close (Sept 11)
- Money Today, "Middle East oil shock sends US and Japanese yields soaring; Nikkei −1.93% [Asia Close]"
- Business Recorder, "Japan's Nikkei slumps as Fed hike bets, soaring oil weigh"
- News On Japan, "Nikkei Drops 2.8% as Oil Shock and Rate Fears Hit Tokyo" (for comparison)
- 24/7 Wall St., Hang Seng and Shanghai closing cards (for comparison)
- Jiji Press, Sept 11 noon yen rate
- Yahoo Finance (Reuters), "European stocks rise but head for sharp weekly declines"
- Investing.com (Reuters), "Dollar holds gains, yen slips as Mideast energy shock deepens"
📌 More market briefs
※ This post is market observation and organization intended to support your own judgment. It is not a recommendation to buy or sell any security. Figures are as of the time of writing and may differ between sources.
If this was useful, bookmark it or pass it along. It genuinely helps me write the next one.
I can survive. We can survive.