Sept 18, 2026 US Market Brief — Nasdaq and S&P 500 Before the Open
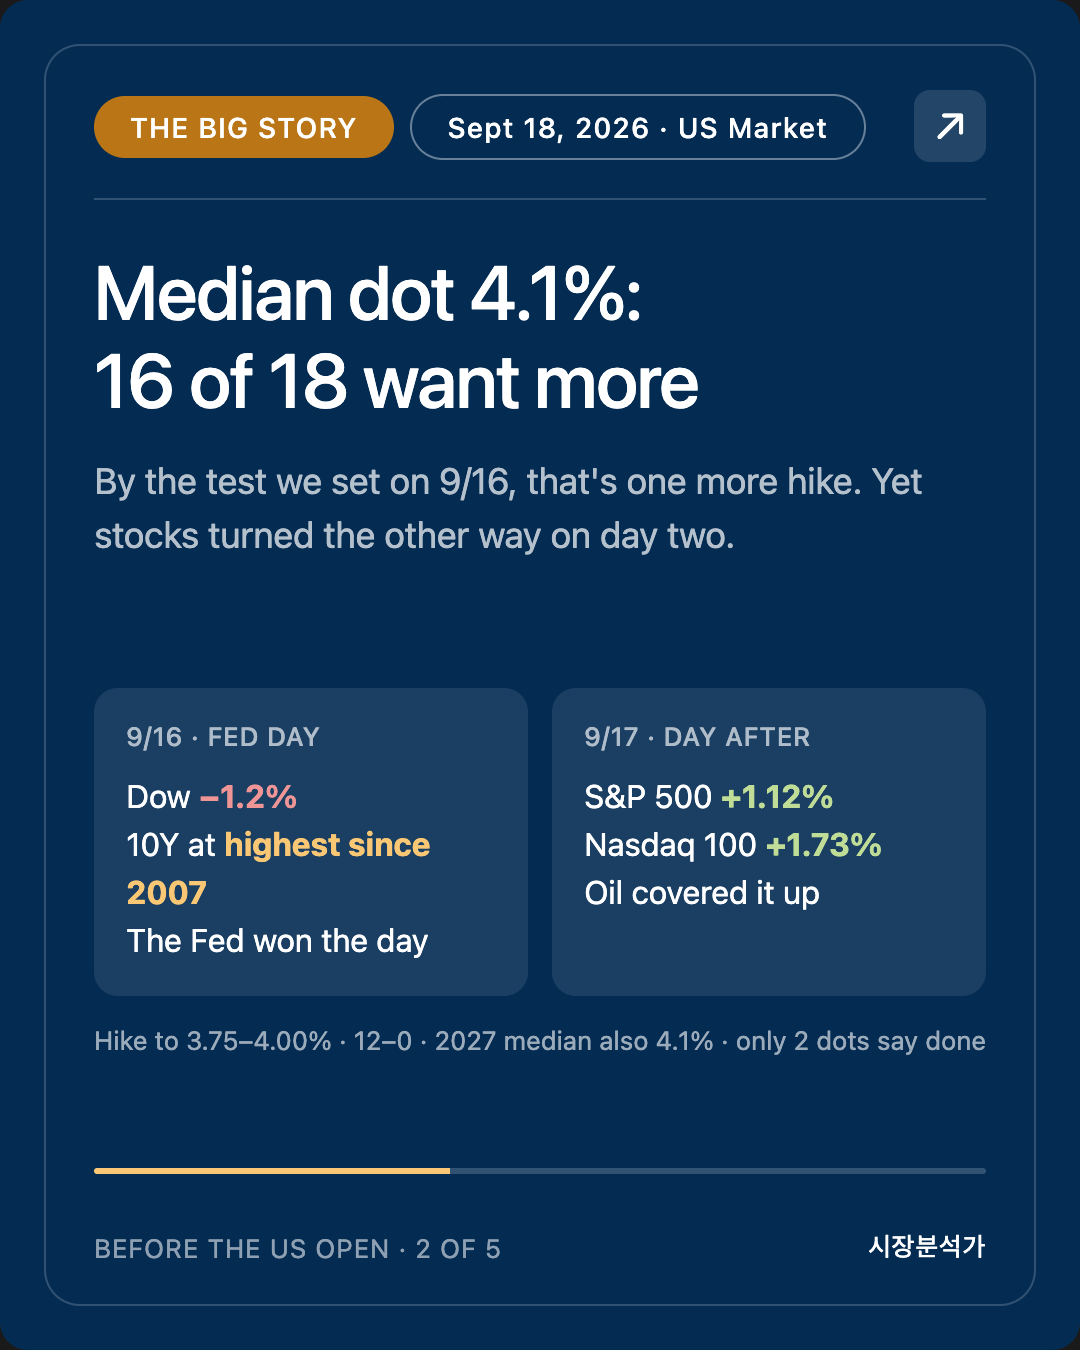
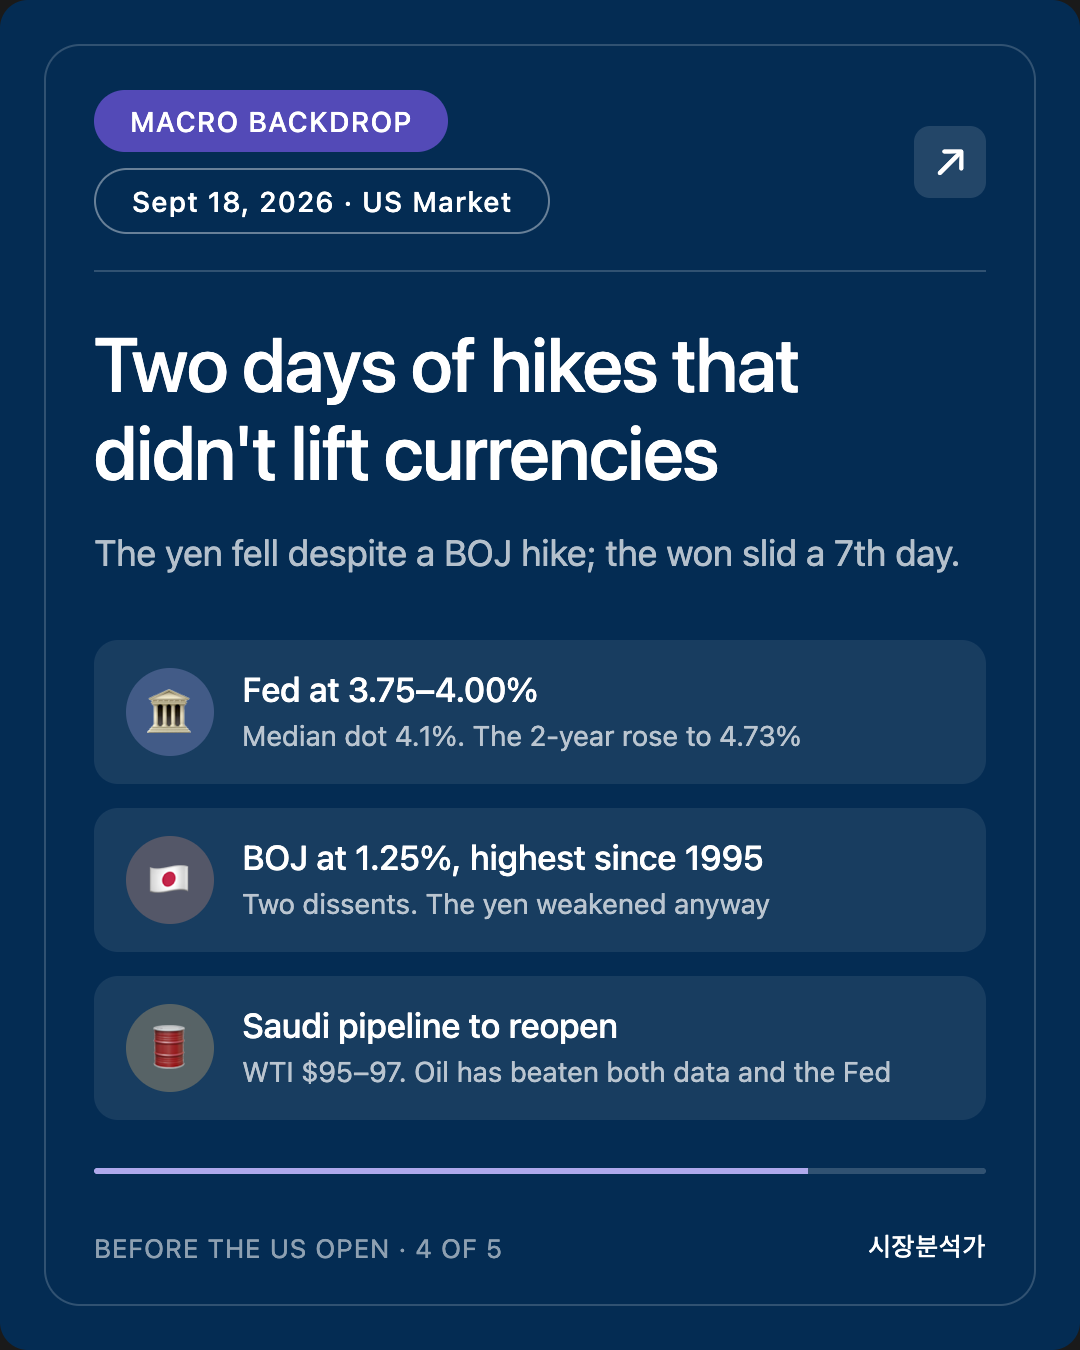
- The Fed hiked and promised more. A unanimous 12–0 vote took the funds rate to 3.75–4.00%, the first hike since July 2023. Median dot for end-2026: 4.1%; for end-2027: also 4.1%. By the test we set on 9/16, that means one more hike.
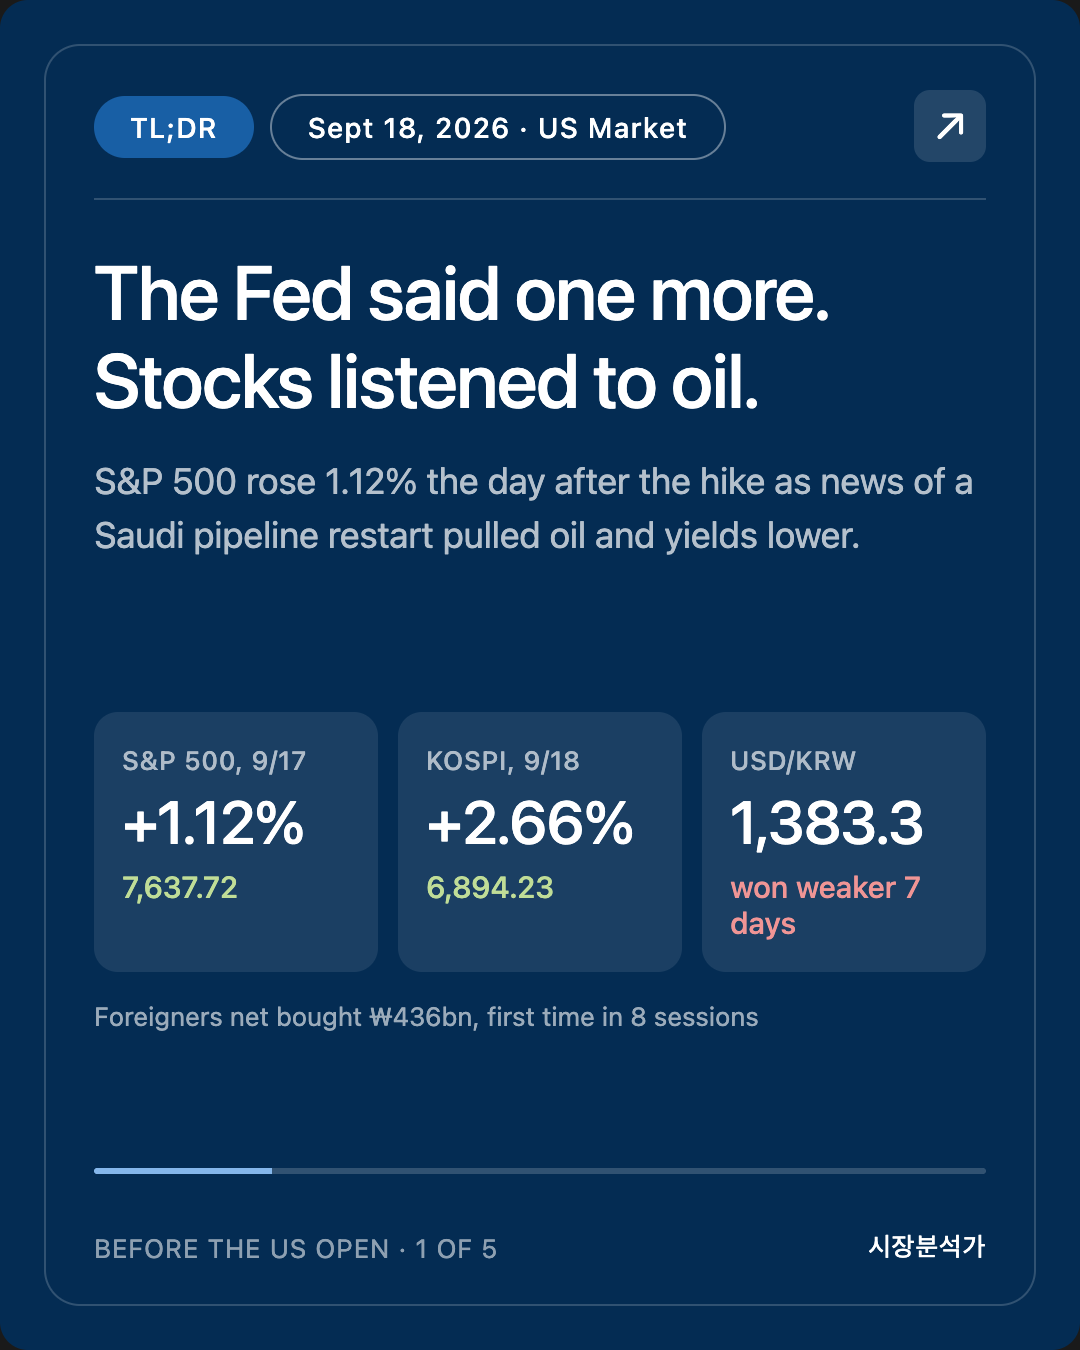
- Stocks reversed within a day. After the Dow fell 1.2% on Fed day, the S&P 500 rose 1.12% to 7,637.72 on Thursday and the Nasdaq 100 1.73%. The trigger was oil: news that the Saudi pipeline will soon reopen pushed crude lower and the 10-year back to 4.94–4.95%.
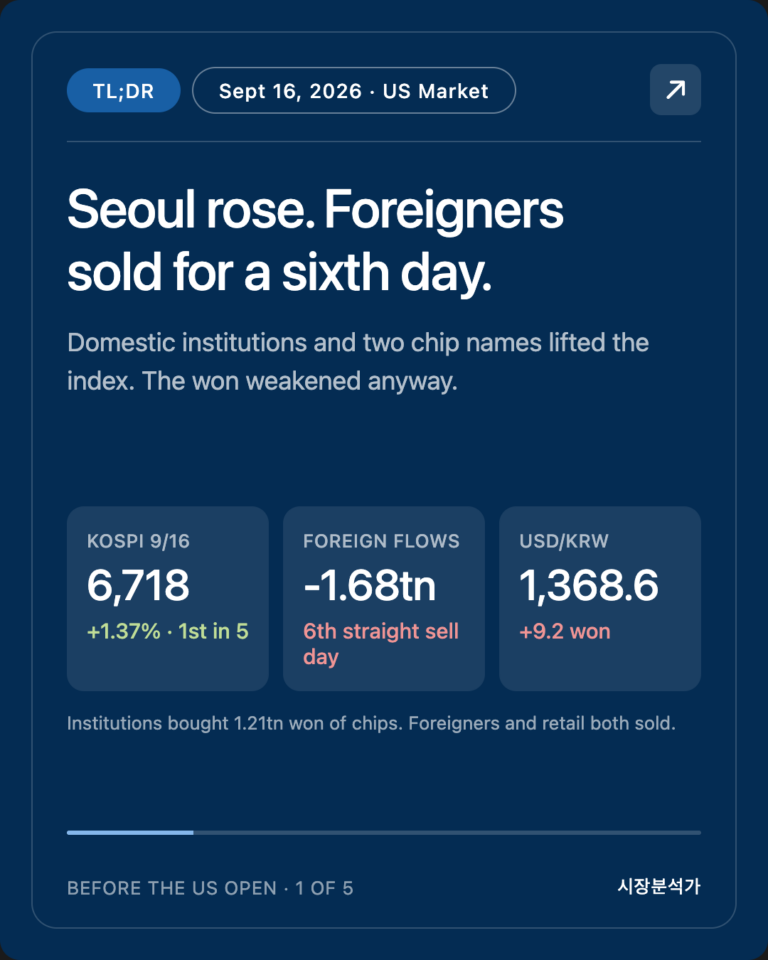
- KOSPI +2.66%, foreigners back after eight days of selling. Foreigners bought a net ₩436.2bn, institutions ₩1.50tn, while retail investors sold ₩3.59tn. SK Hynix +6.42%, Samsung Electronics +3.37%. 🔴 But USD/KRW rose to 1,383.3, the won's seventh straight daily decline.
- The Bank of Japan hiked too, to 1.25%, the highest since 1995. Two board members dissented, and the yen weakened anyway (155–157 per dollar).
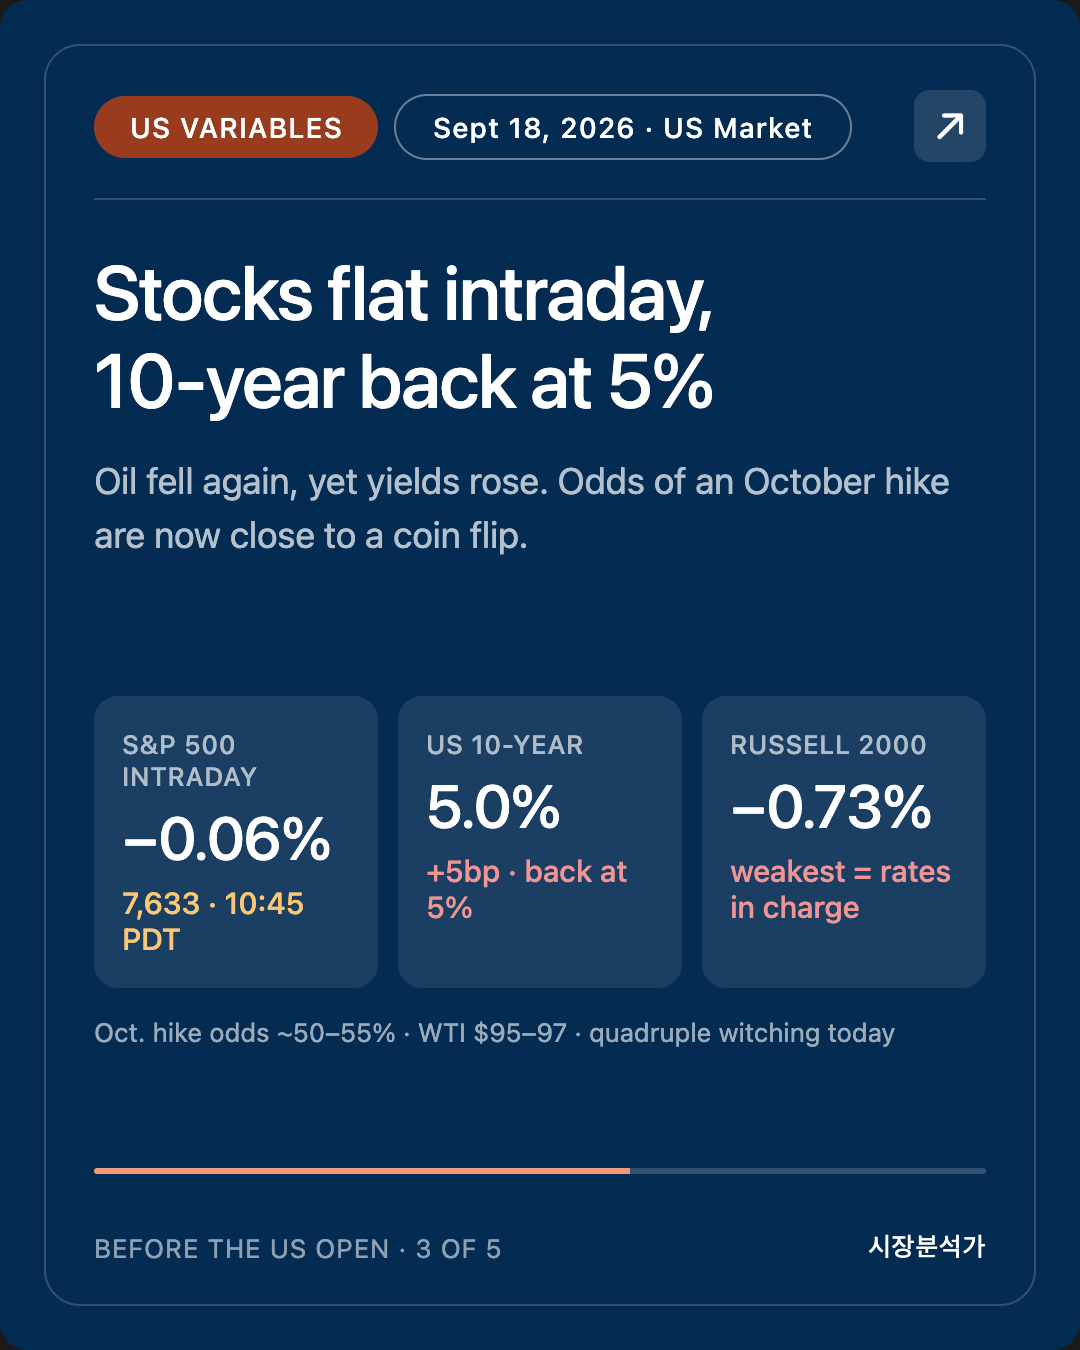
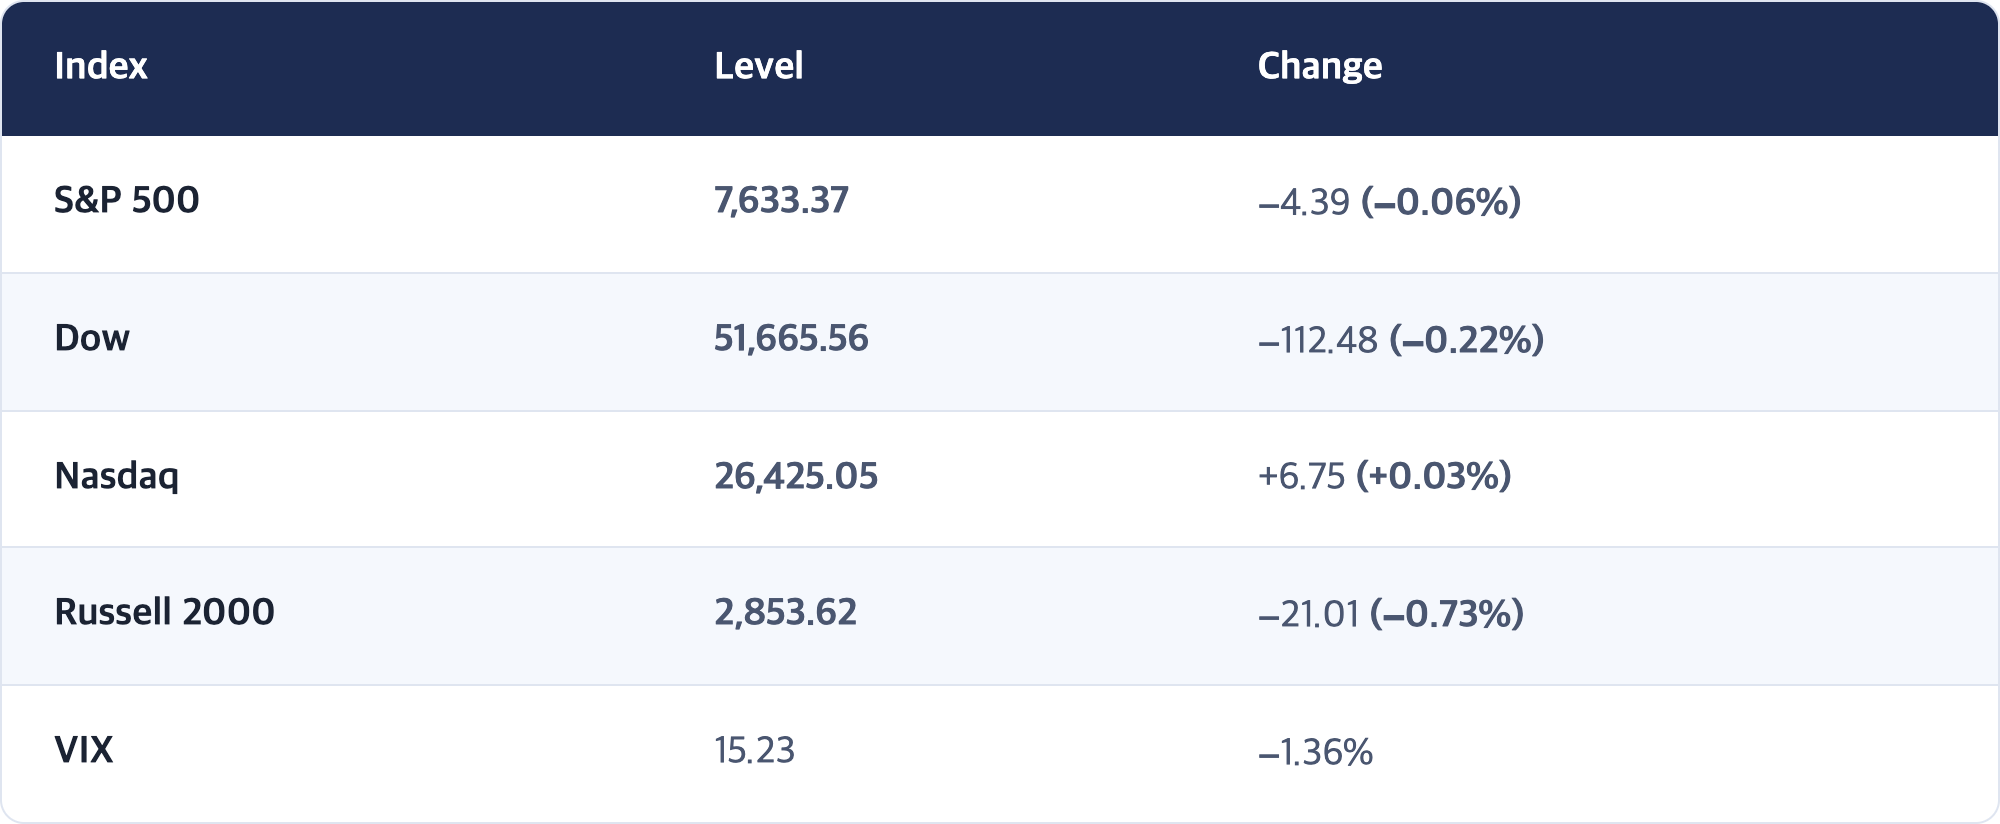
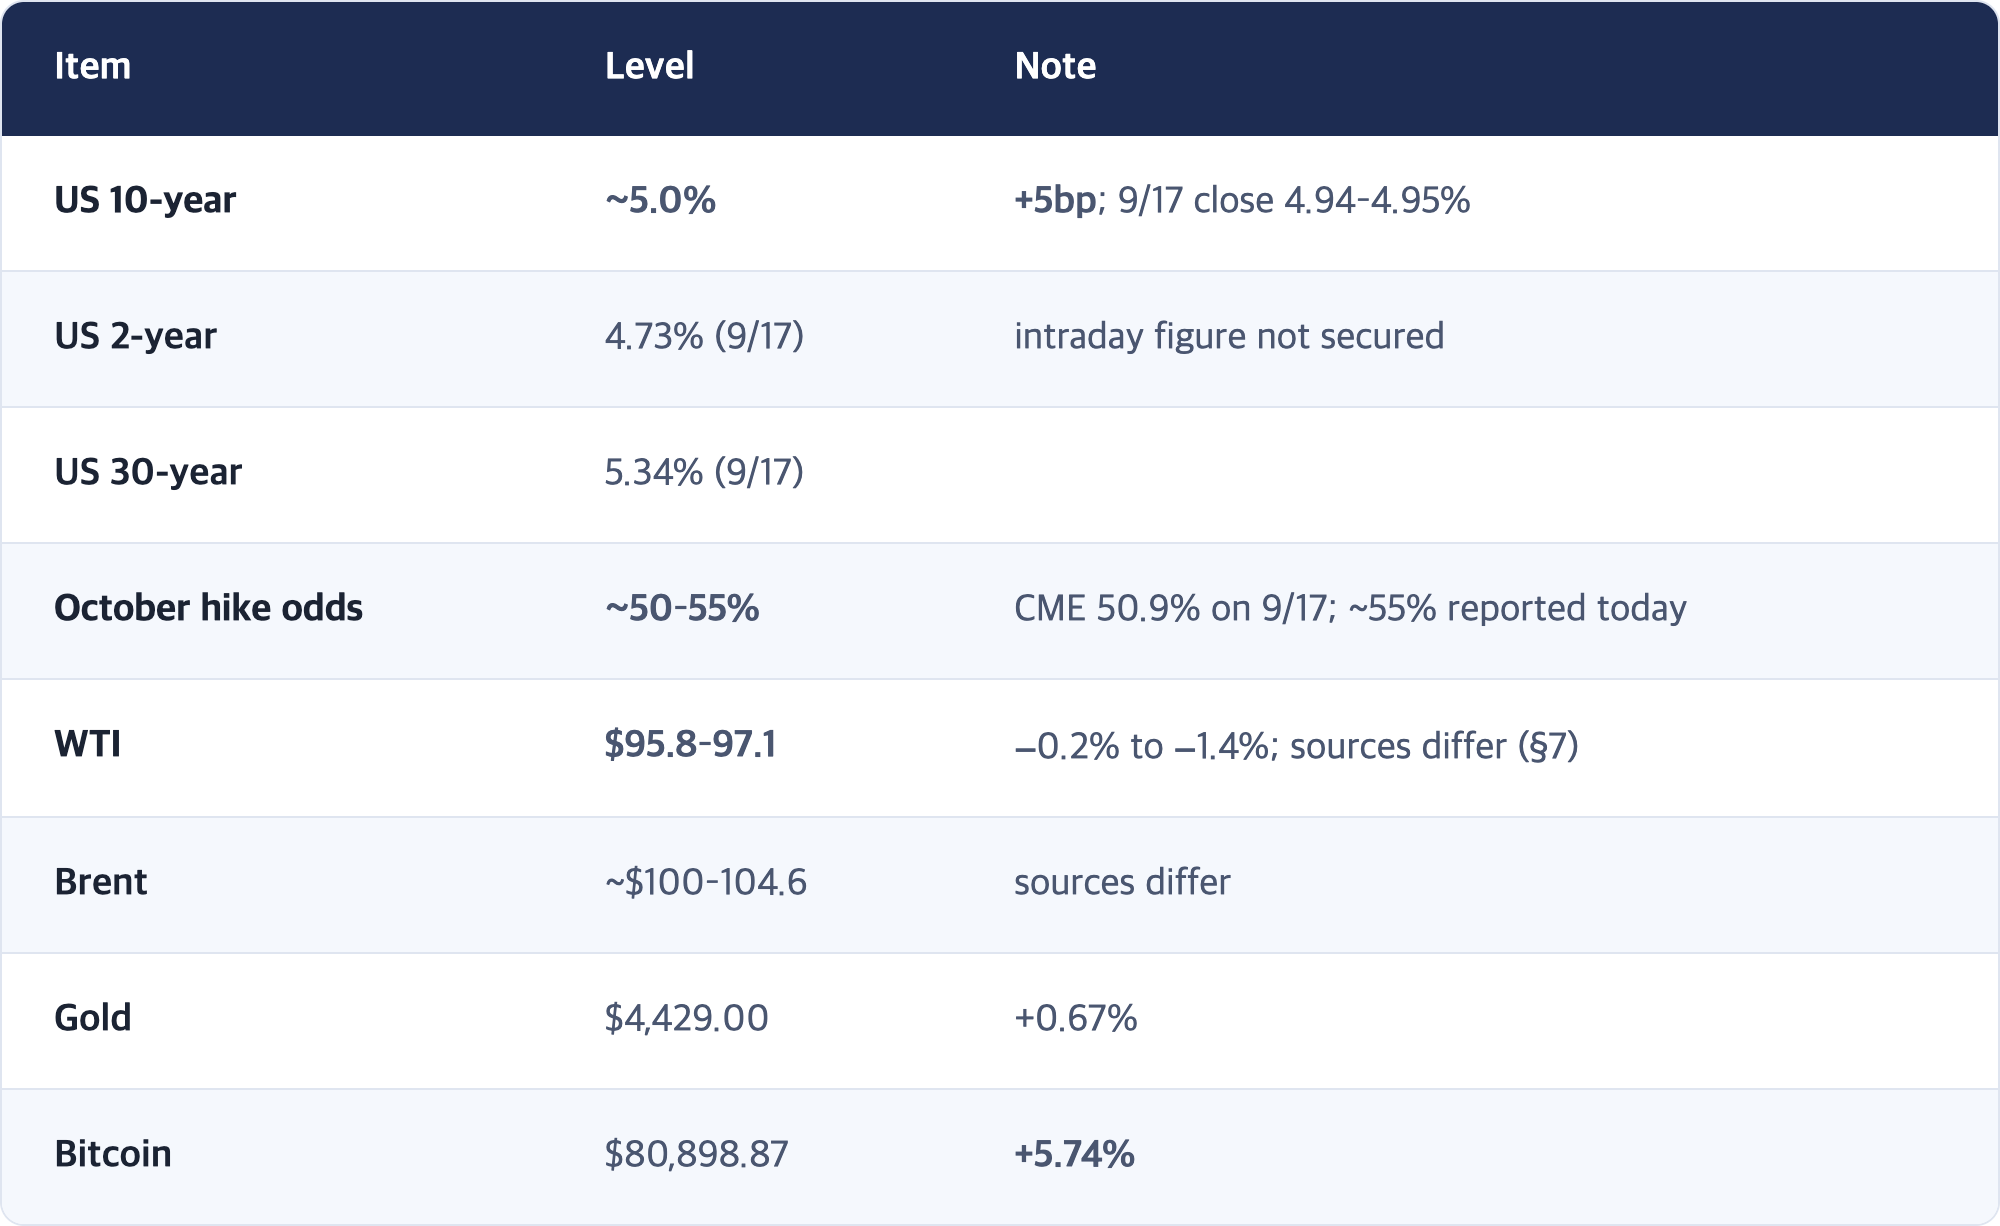
- Today, intraday (~10:45 PDT), stocks are flat. S&P 500 −0.06%, Nasdaq +0.03%, Russell 2000 −0.73%. 🔴 The 10-year is back at 5.0% (+5bp) as traders price roughly 50–55% odds of another hike in October. WTI is lower again at $95–97.
This is Mr. Can. Here is the Sept 18, 2026 brief ahead of the US market open.
Written: 2026-09-18 11:35 PDT (Korea: Sat 9/19 03:35 KST)
Basis: Korea/Asia closes for 9/18 + Europe intraday + US regular session intraday (~10:45 PDT)
🔴 This edition ran late. It was scheduled for 05:30 PDT and started at 11:31 PDT, about six hours behind. The US market had already been open for five hours, so every US number below is an intraday figure, not a pre-market one.
🔴 The three editions before this one were not produced (9/16 PM, 9/17 AM, 9/17 PM). This brief covers three days at once: the Fed decision on 9/16, Thursday's rebound, and today.
SEO Intro
On the morning of September 16 we said the Fed meeting came down to one dot. If the median 2026 year-end projection landed above 4.00%, the Fed was telling us "one more hike." If it landed exactly at 4.00%, it was saying "we're done."
It landed at 4.1%. Sixteen of eighteen officials see at least one more increase this year. The Fed's answer was plain: not done yet.
Yet the stock market moved past that message within a day. On Thursday the S&P 500 rose 1.12% and the Nasdaq 100 1.73%, after the US Energy Secretary said Saudi Arabia's East-West pipeline, the main bypass around the Strait of Hormuz, would be restored soon. Oil fell, and Treasury yields fell with it.
Today in Seoul, foreign investors turned net buyers for the first time in eight sessions and the KOSPI jumped 2.66% to 6,894.23. But the Korean won weakened for a seventh straight day, and in New York the 10-year yield is back at 5%.
This week, stocks were lifted by oil, not by the Fed. And the bond market is still listening to the Fed.
1. Scoring the 9/16 Checkpoints
These are the four markers our 9/16 AM brief set on Fed day. The axis was: did the Fed answer a question about the rate path, or about inflation? Two editions were skipped, so we score them here.
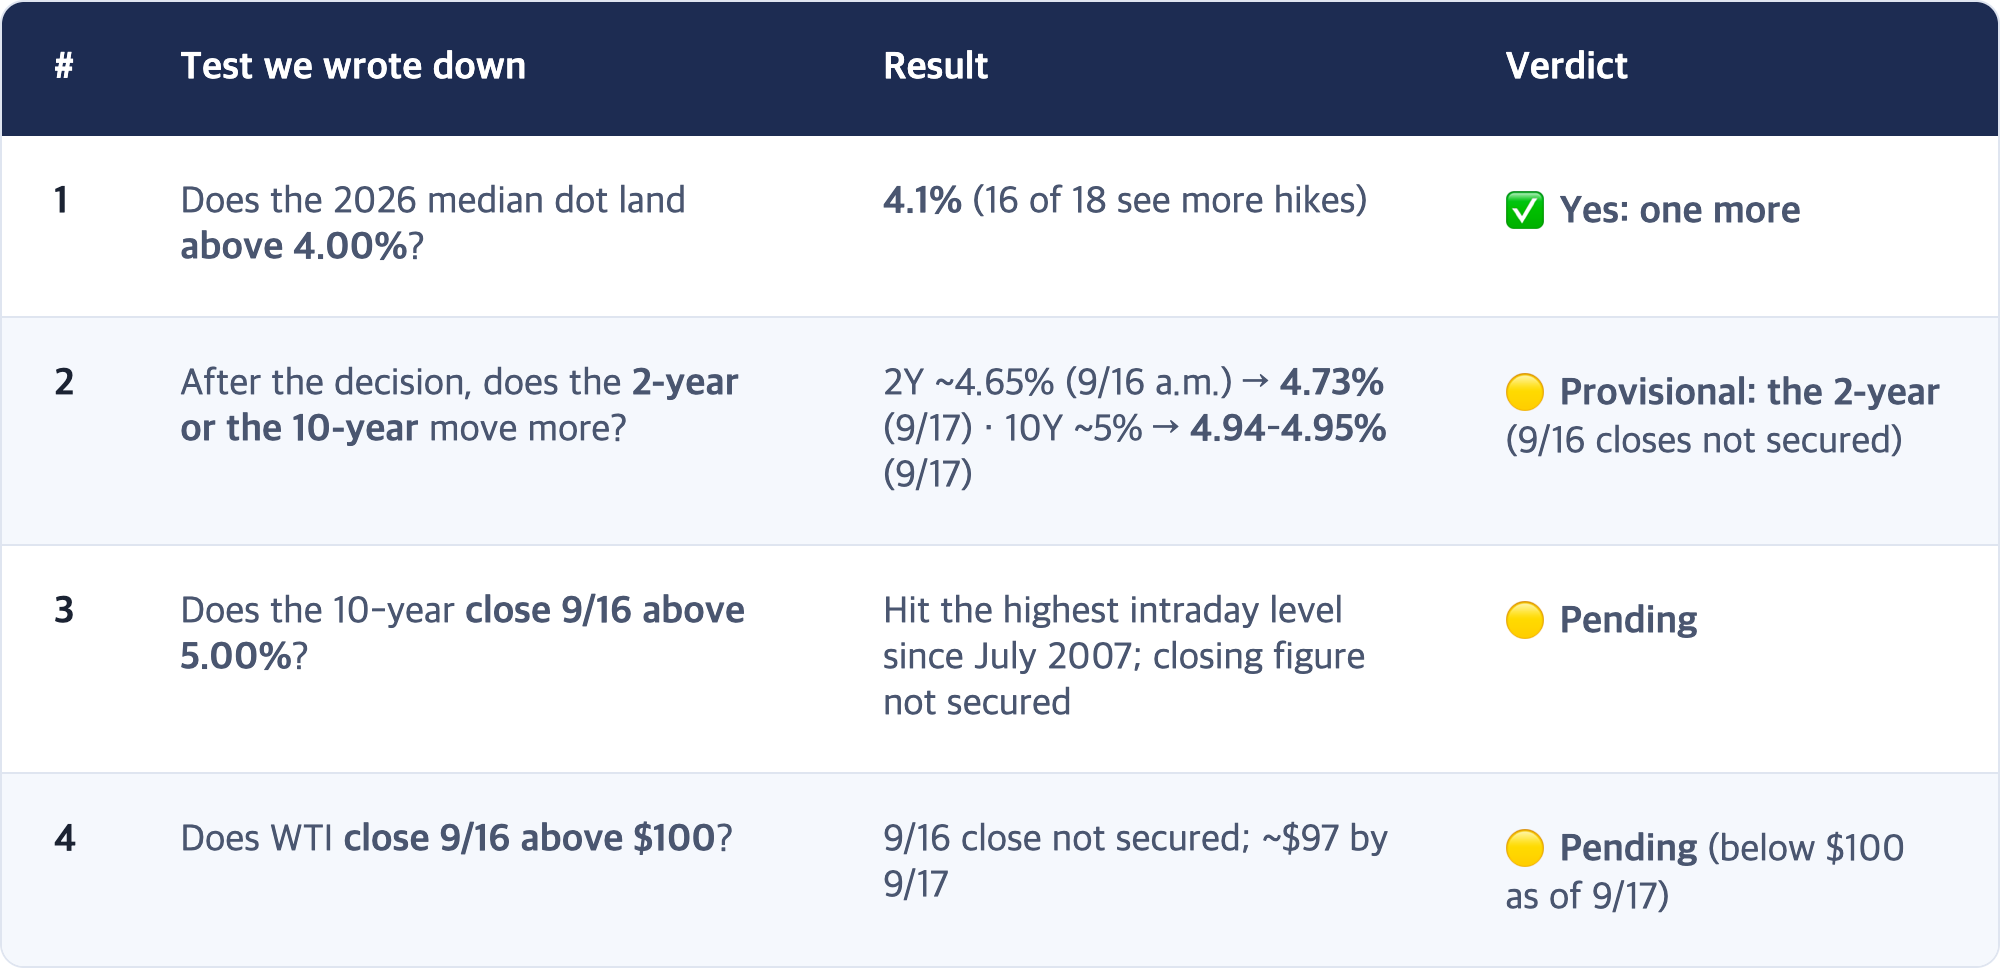
Reading 1 and 2 together: the front end of the curve (2-year) rose while the long end (10-year) fell. The 2-year is the part of the curve the Fed controls, so its rise means the market accepted the "one more hike" message. The 10-year fell because of oil, not the Fed. The Fed moved short rates; oil moved long rates.
2. The Big Story: The Fed Said "One More," Stocks Listened to Oil
[Fact] The 9/16 FOMC decision
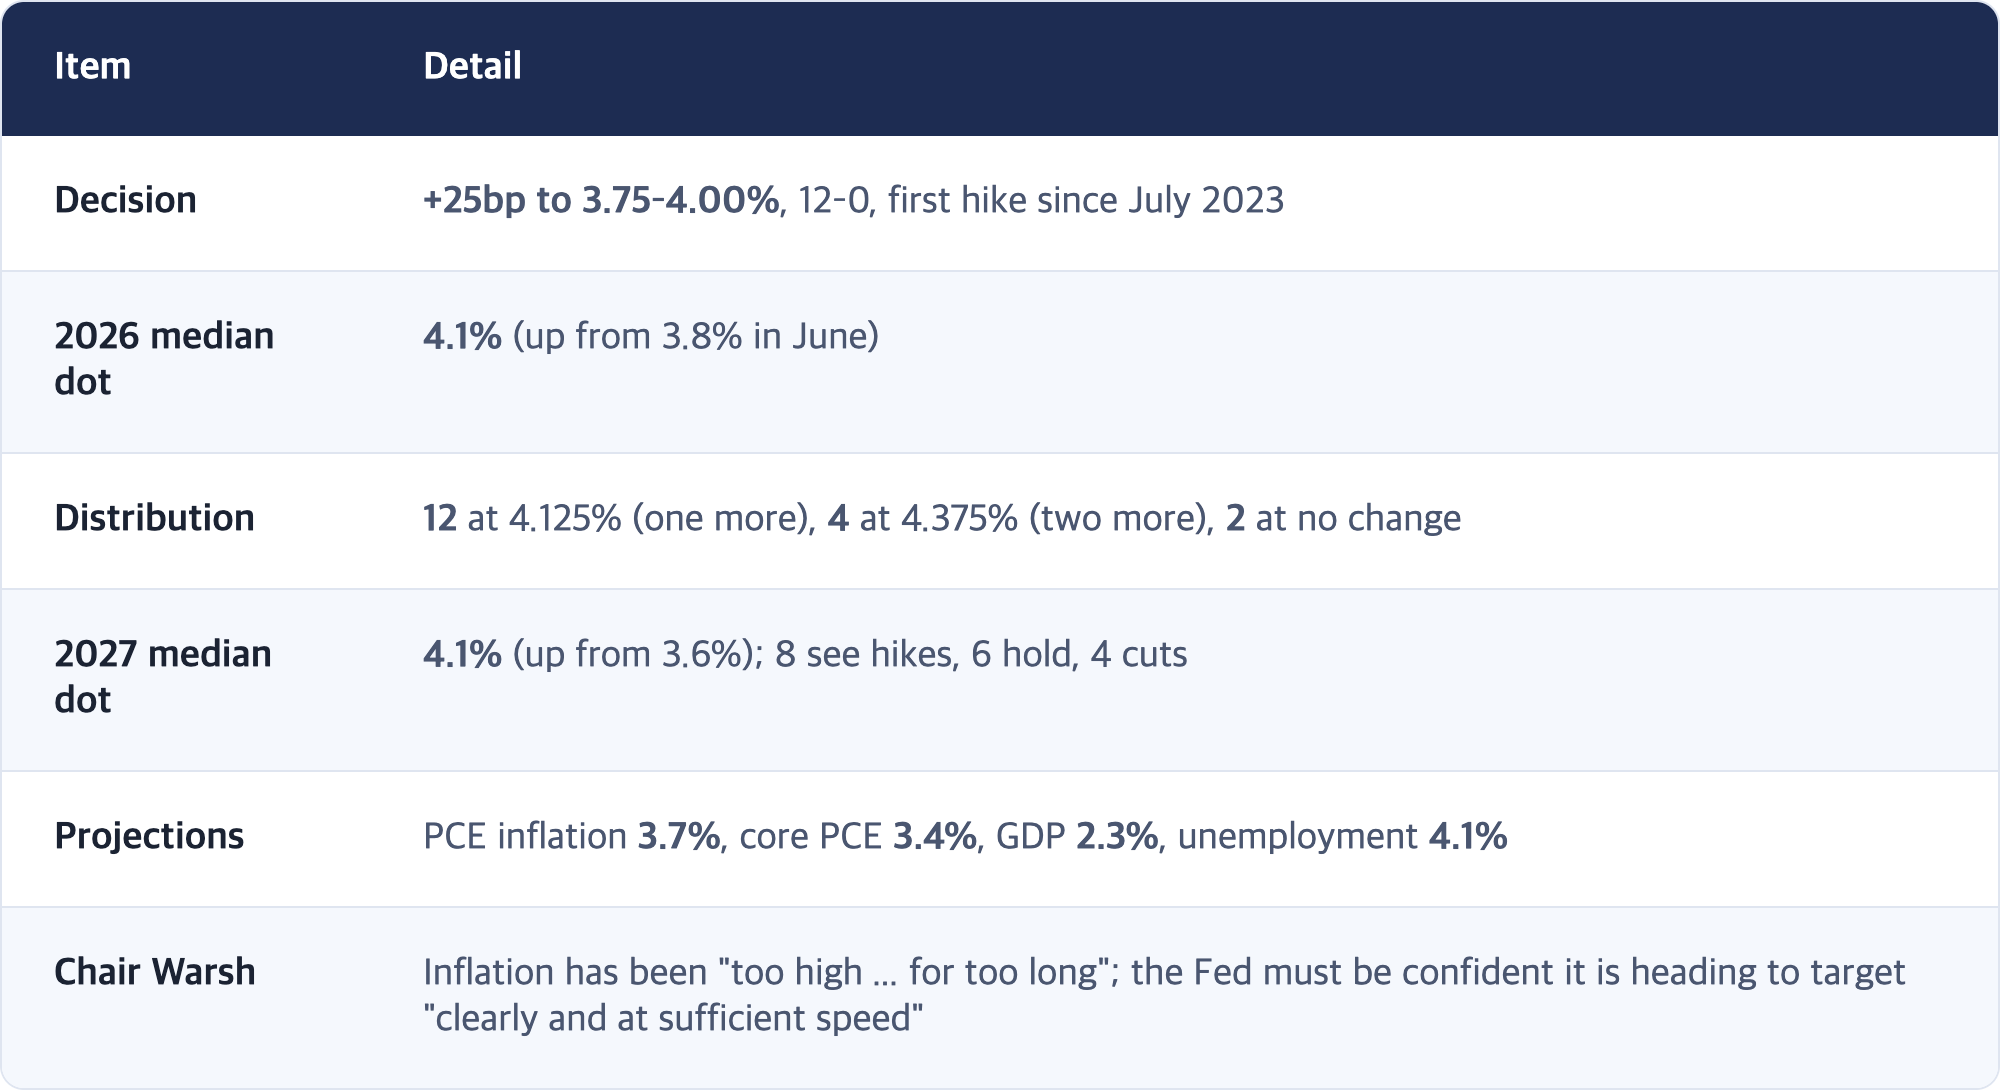
Chair Warsh has not submitted a dot since taking office, so there are 18 dots.
[Fact] Two days, two opposite reactions
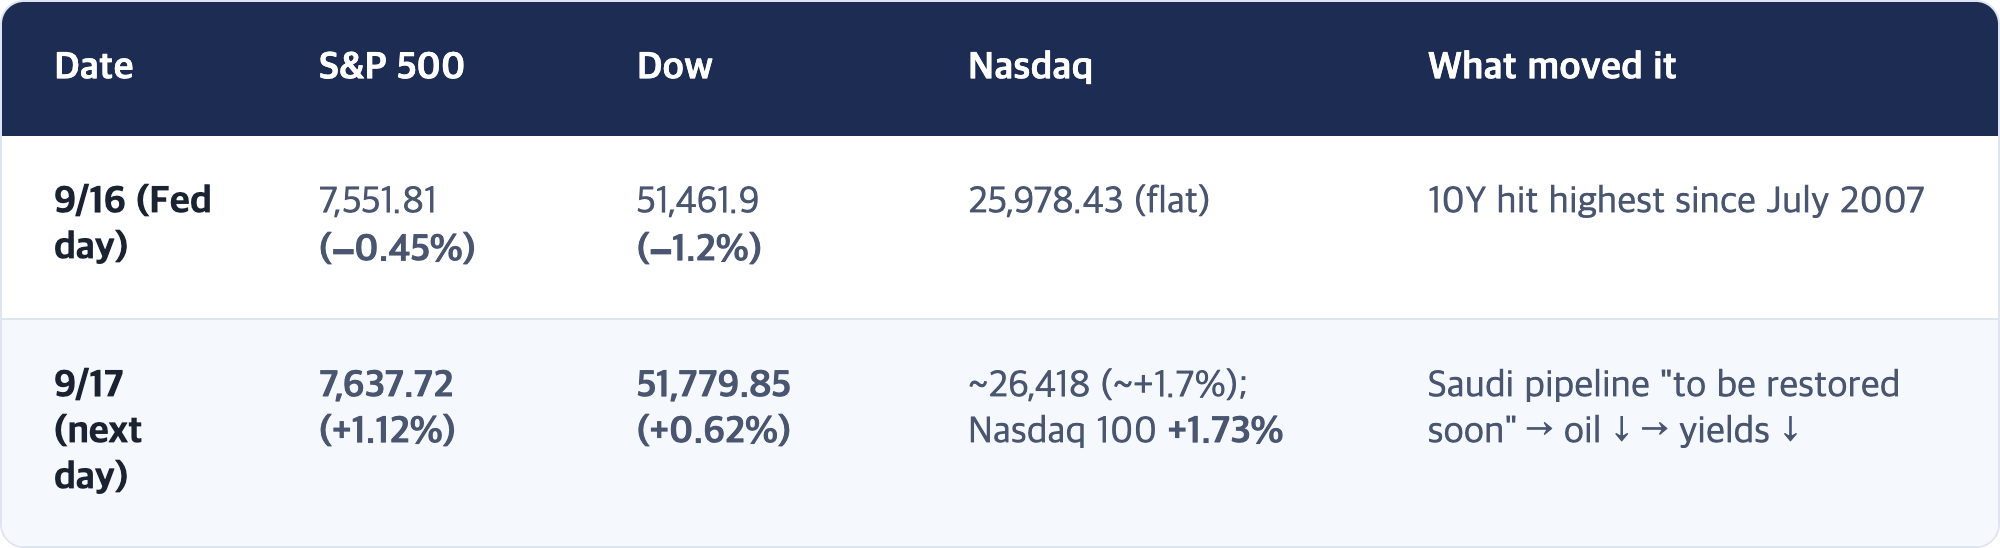
🔴 [Analysis] The Fed's words and the market's weather diverged
On 9/16 we wrote that a hawkish dot would push US yields up, drag Korean yields along, and weaken the won. Day one went exactly that way. Day two went the other way: the Fed was hawkish and stocks rallied anyway, because oil fell.
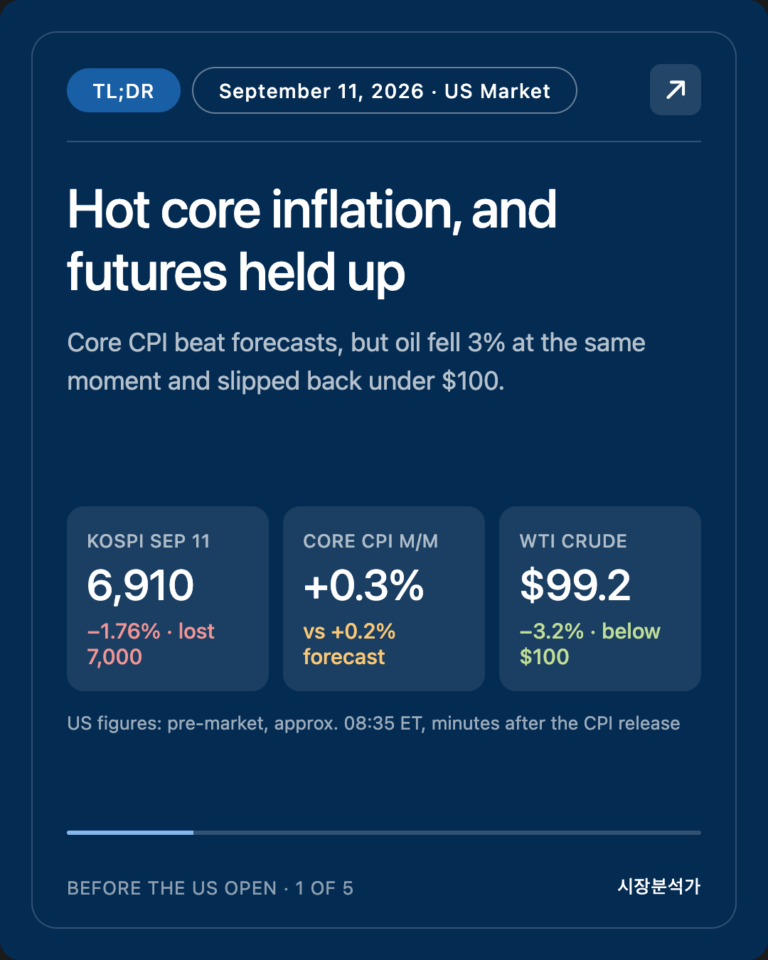
We have seen this pattern before this month. On 9/10 and 9/11, oil overpowered first a good inflation print and then a bad one. This time oil overpowered a hawkish Fed. So far in September, neither the data nor the Fed has beaten oil.
[Analysis] But today the bond market went back to the Fed
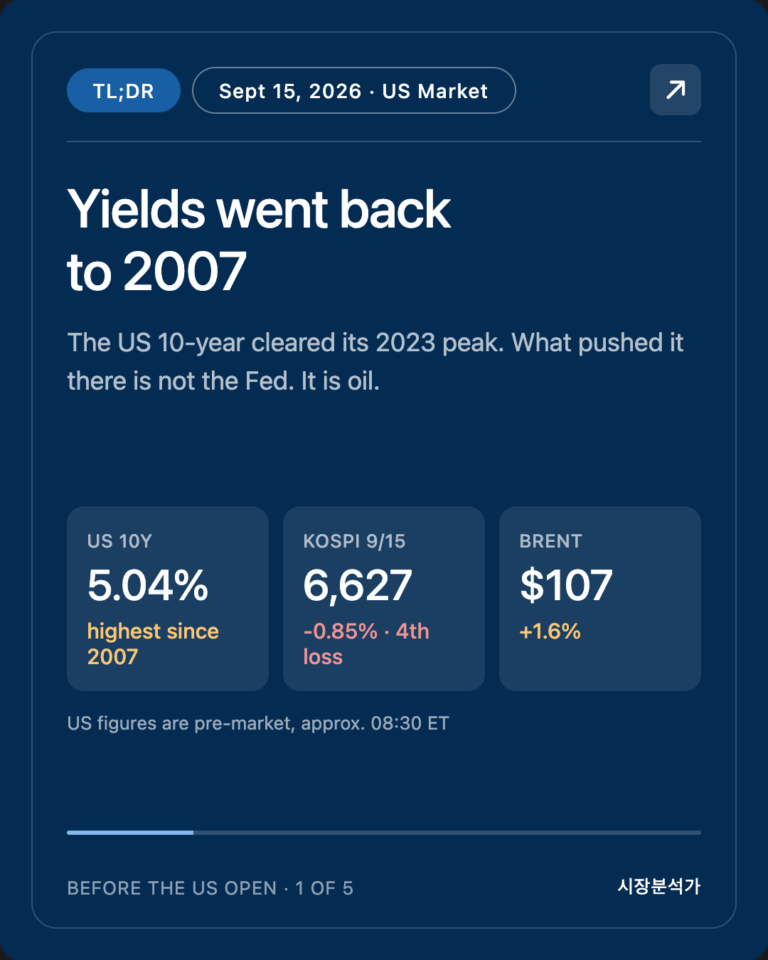
Today the 10-year is back at 5.0% (+5bp) even though oil is lower again. The reported reason is growing bets on an October hike. Yesterday oil pulled yields down; today oil fell further and yields rose anyway. Stocks are watching oil. Bonds are watching the Fed. Those two rarely look in different directions for long.
3. US Variables: Flat Stocks, Rising Yields
[Fact] 9/18 regular session, intraday (~10:45 PDT)
[Fact] Rates, commodities, FX
[Observation] Inside today's session
- Chips bounced. The semiconductor ETF (SMH) was up close to 3%, though the Philadelphia Semiconductor Index is still slightly down for the week after the sell-off on 9/14, when leading AI lab CEOs called for slowing the pace of AI development.
- The Russell 2000 is the weakest index (−0.73%). Under the rule this brief has used since 9/11, when small caps lag the most, the market is still trading on rates, which fits today's +5bp in the 10-year.
- Today is quadruple witching, when stock and index futures and options expire together. Expect heavy volume and a noisier close than usual.
4. Asia and Europe (9/17–9/18)
[Fact] Korea, 9/18
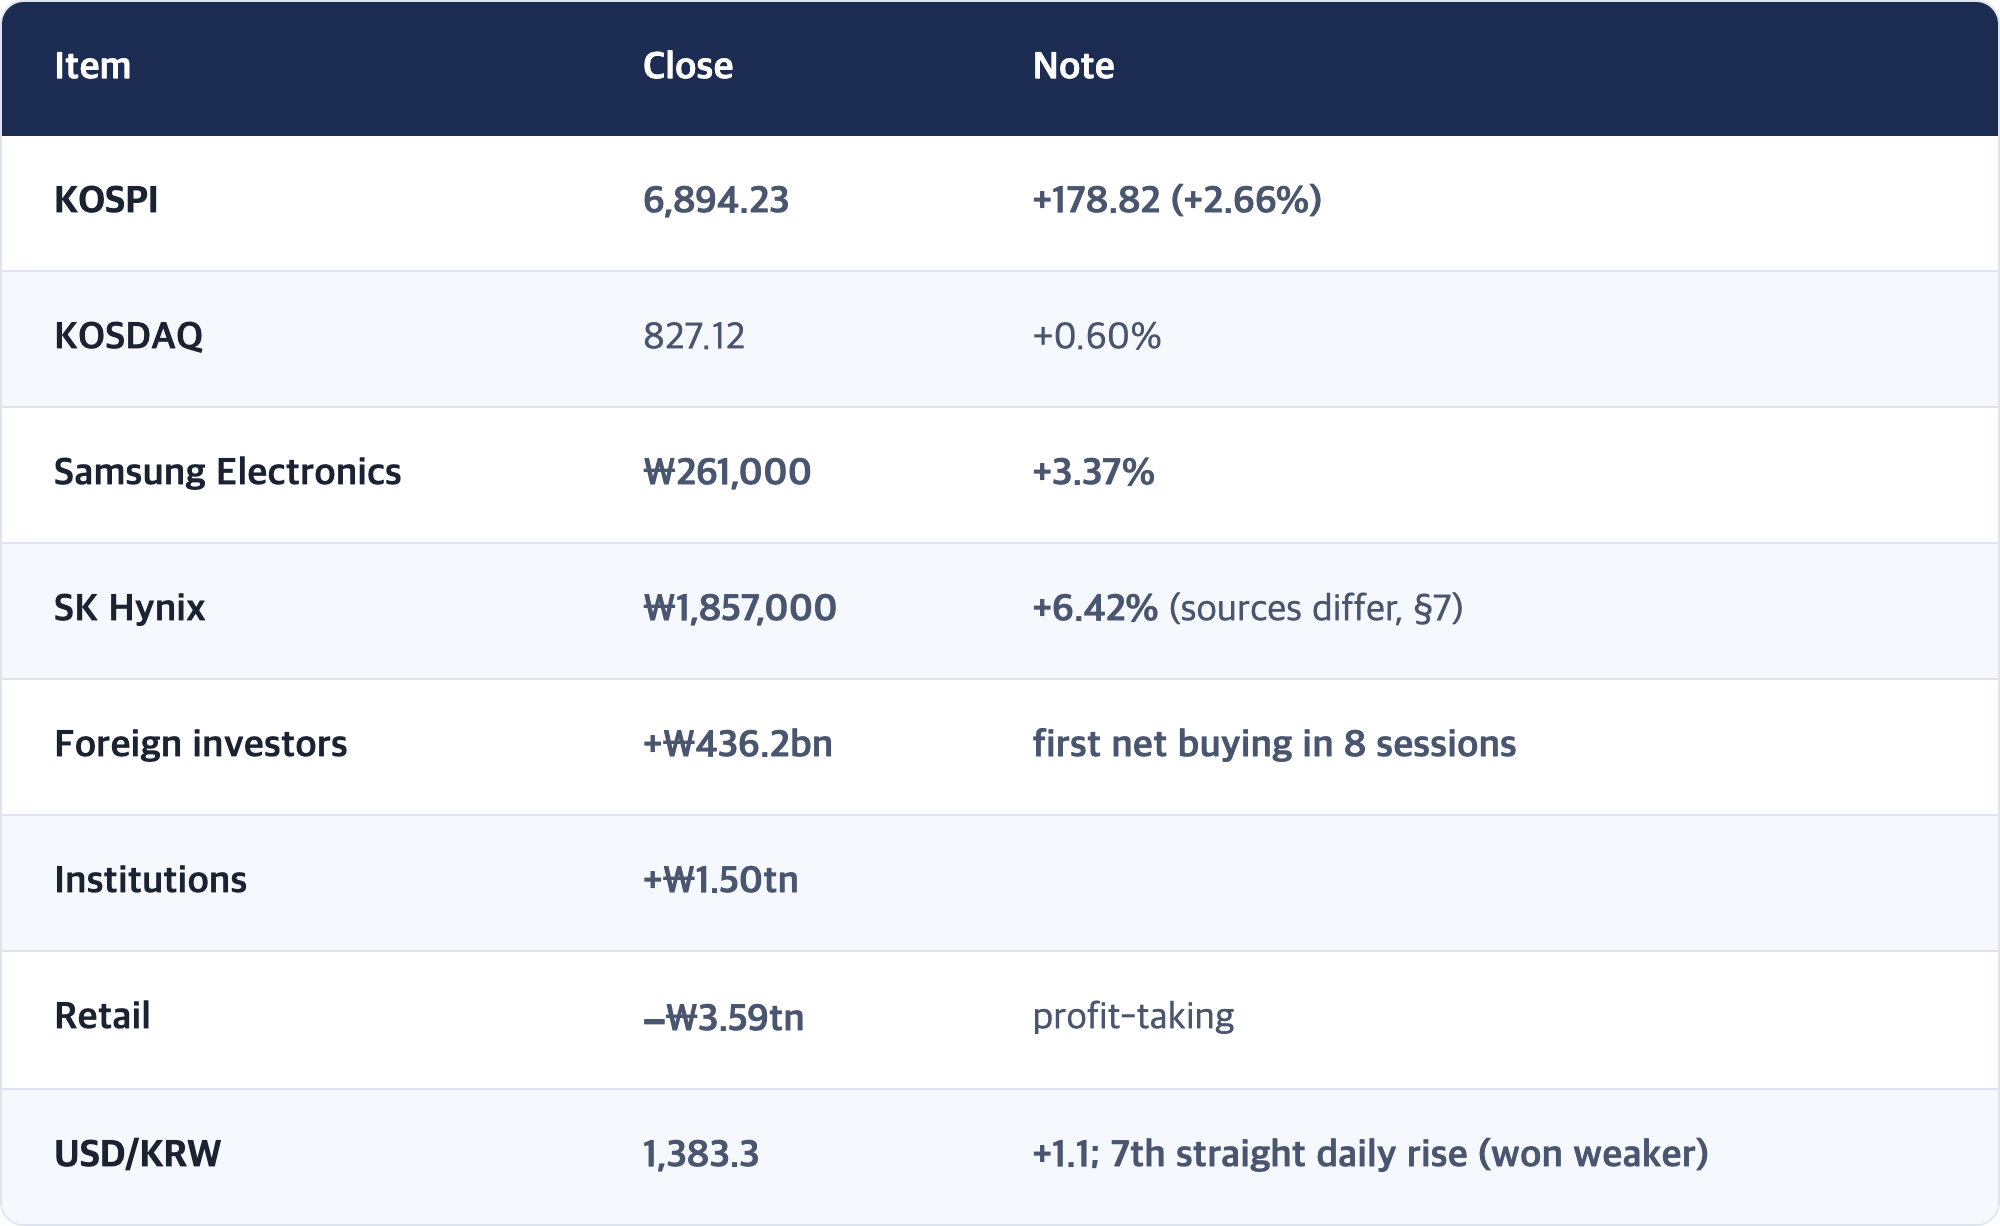
🔴 [Analysis] Foreign money came back; the won did not
On 9/16 we argued that what would bring foreign investors back to Korea was not Korean earnings but the direction of US rates. That was half right. Foreigners returned the day after the 10-year dipped below 5%, despite a hawkish Fed. More precisely, what brought them back was the drop in US yields that oil produced, not anything the Fed said.
Normally foreign buying of Korean stocks strengthens the won. This time the won kept weakening. Two explanations are possible: (1) a ₩436bn net purchase is small next to eight days of selling, or (2) a broadly strong dollar is pressing on the won regardless of equity flows. One day of data can't separate the two. Until the won turns, it's too early to call the foreign return a trend.
[Fact] Japan, China, Europe
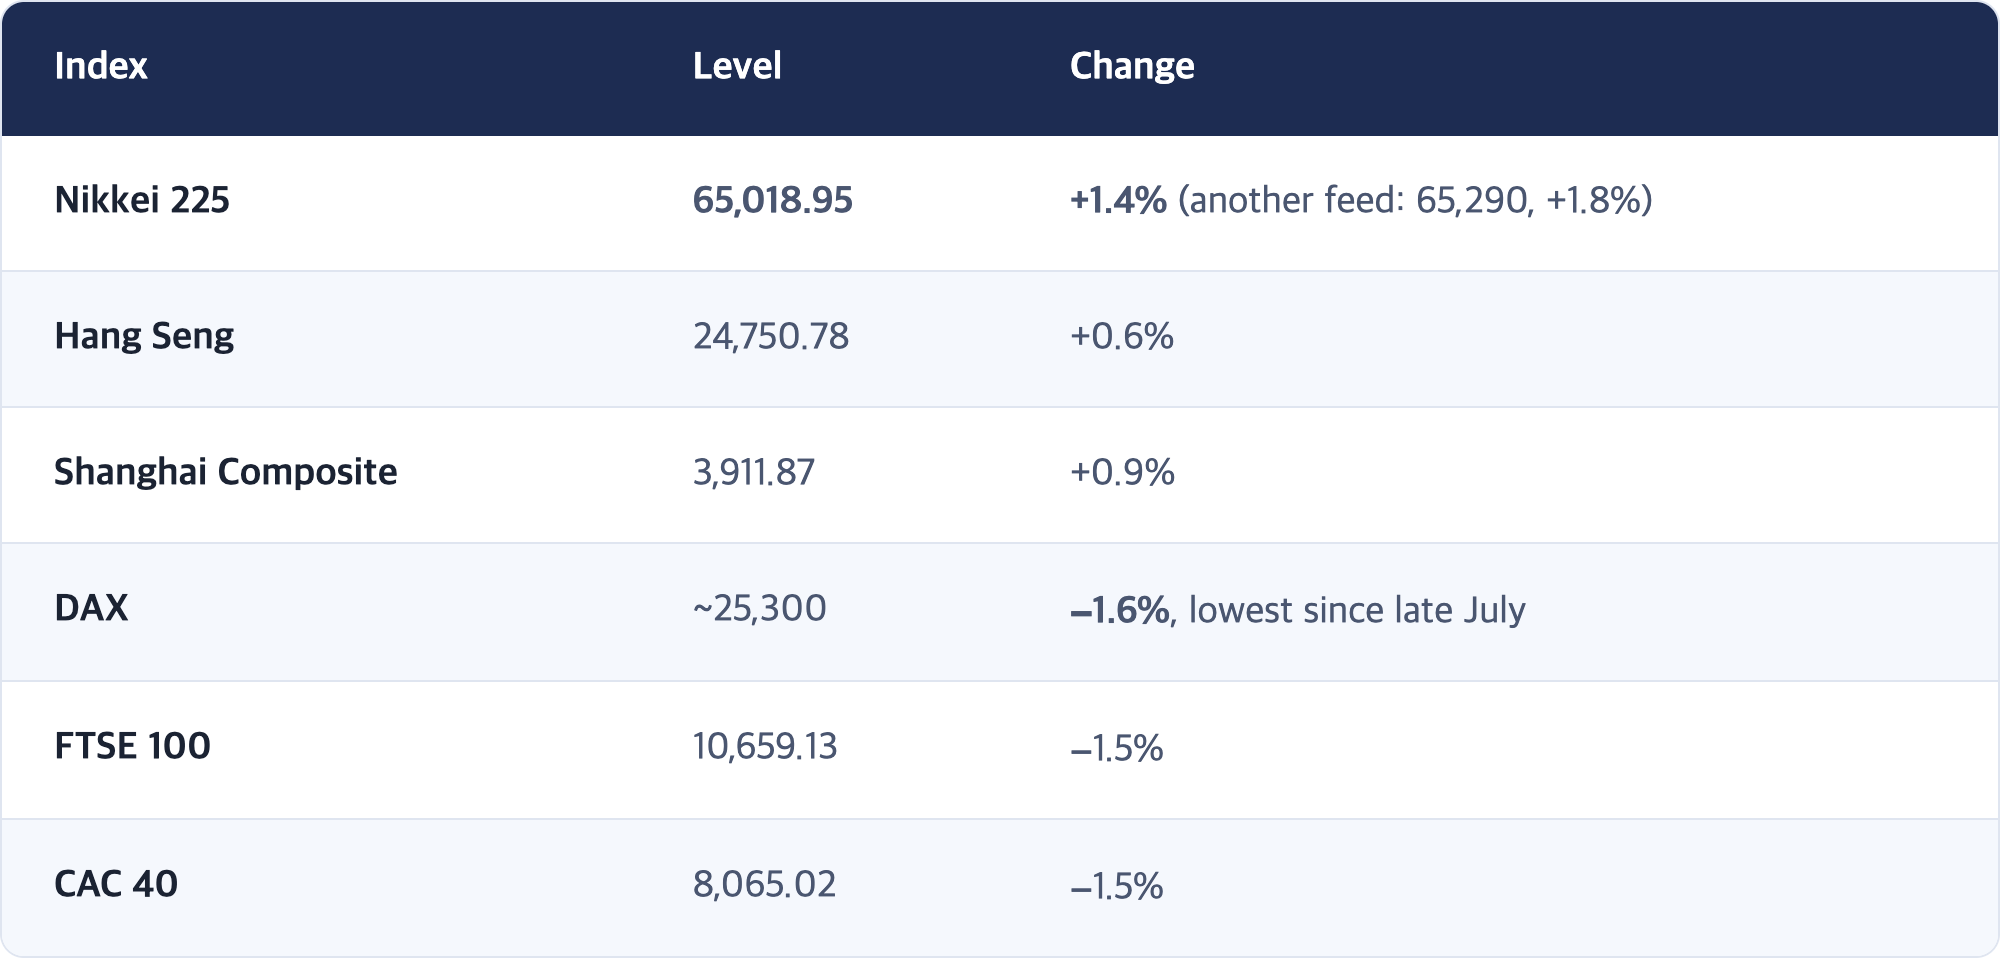
The Bank of Japan raised its policy rate from 1.00% to 1.25%, the highest since 1995 and only three months after its previous hike. But the vote was 7–2, and the dissents made further hikes look harder, so the yen weakened.
Europe sold off broadly in the afternoon, led by autos (Volkswagen −5.97%), telecoms and banks, with options expiry and caution ahead of next week's summit between President Trump and Gulf leaders.
[Analysis] A second case of a rate hike that didn't lift a currency
On 9/16 we noted that raising rates doesn't strengthen a currency if the other side is raising faster. Two days later the BOJ proved it. The won sits in the same spot: the US hiked, Japan hiked, and the Bank of Korea hasn't moved. Seven straight days of won weakness look less like a Korea-specific problem and more like a rate-gap problem.
5. The Rest of Today and Next Week (PDT)
[Observation] Where we stand
The regular session closes at 13:00 PDT (Korea: Sat 9/19 05:00). Stocks are flat; only the 10-year has moved back up to 5.0%. Against last Friday's close (9/11, 7,656.98), the S&P 500 is about −0.3% for the week: still negative despite Thursday's rally.
[Analysis] The week in one sentence
The Fed said "one more," and oil covered it up for two days. Today's close shows whether that cover survives the weekend. Next week's Trump–Gulf summit is the oil-side catalyst; the inflation data before the October 28 FOMC is the Fed-side catalyst.
✅ Four Checkpoints (today's close + next week's first session)
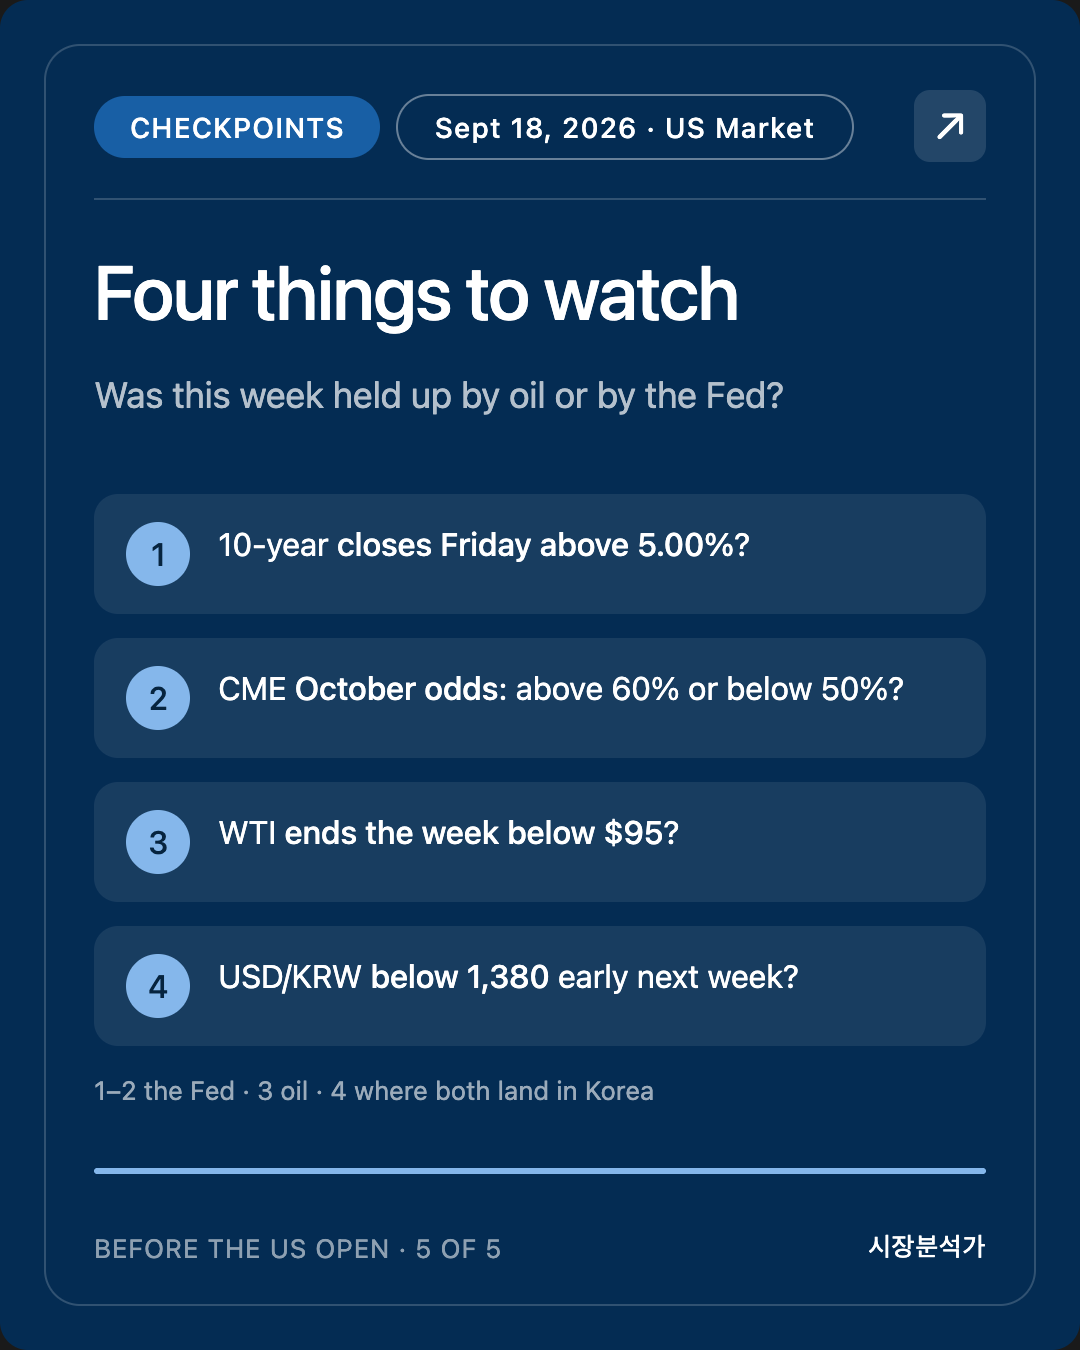
- Does the 10-year close Friday above 5.00%? It's at 5.0% intraday. A close above makes "yields follow the Fed even when oil falls" the lesson of the week
- Do CME October hike odds climb above 60% or fall below 50%? They sit at roughly a coin flip today
- Does WTI finish the week below $95? That would tell us the pipeline news is fully priced and oil's cushion under stocks has thickened
- Does USD/KRW fall back below 1,380 early next week? If the won stays in the 1,380s even as foreigners keep buying, the weakness is about the rate gap, not equity flows
The axis: these four separate whether this week's market was held up by oil or by the Fed. 1–2 watch the Fed, 3 watches oil, 4 is where both land in Korea. If 1–2 turn firmly hawkish while 3 holds, expect another week of stocks and bonds telling different stories.
6. Study Note: How to Read the Median Dot
The Fed moves in 25bp steps, so a 4.1% policy rate doesn't actually exist. Here's what the number means.
The concept
Each FOMC participant places one dot where they think the policy rate should be at year-end. With 18 participants there are 18 dots. The median is the middle value when you line them up from lowest to highest. It is not the average.
This time there were 12 dots at 4.125%, 4 at 4.375%, and 2 at 4.00%. The 9th and 10th dots are both 4.125%, rounded to 4.1% in the release. And 4.125% is the midpoint of 4.00–4.25%, the range one step above today's 3.75–4.00%. So 4.1% means one more hike this year.
An analogy
Ask 18 students what time they expect to get home tonight. If one or two say "11 p.m.," the average jumps. But if you line everyone up and take the answer of the student in the middle, you get what most of the class thinks, unmoved by the outliers. That's why the Fed publishes the median: it shows the committee's center of gravity.
Look beyond the median
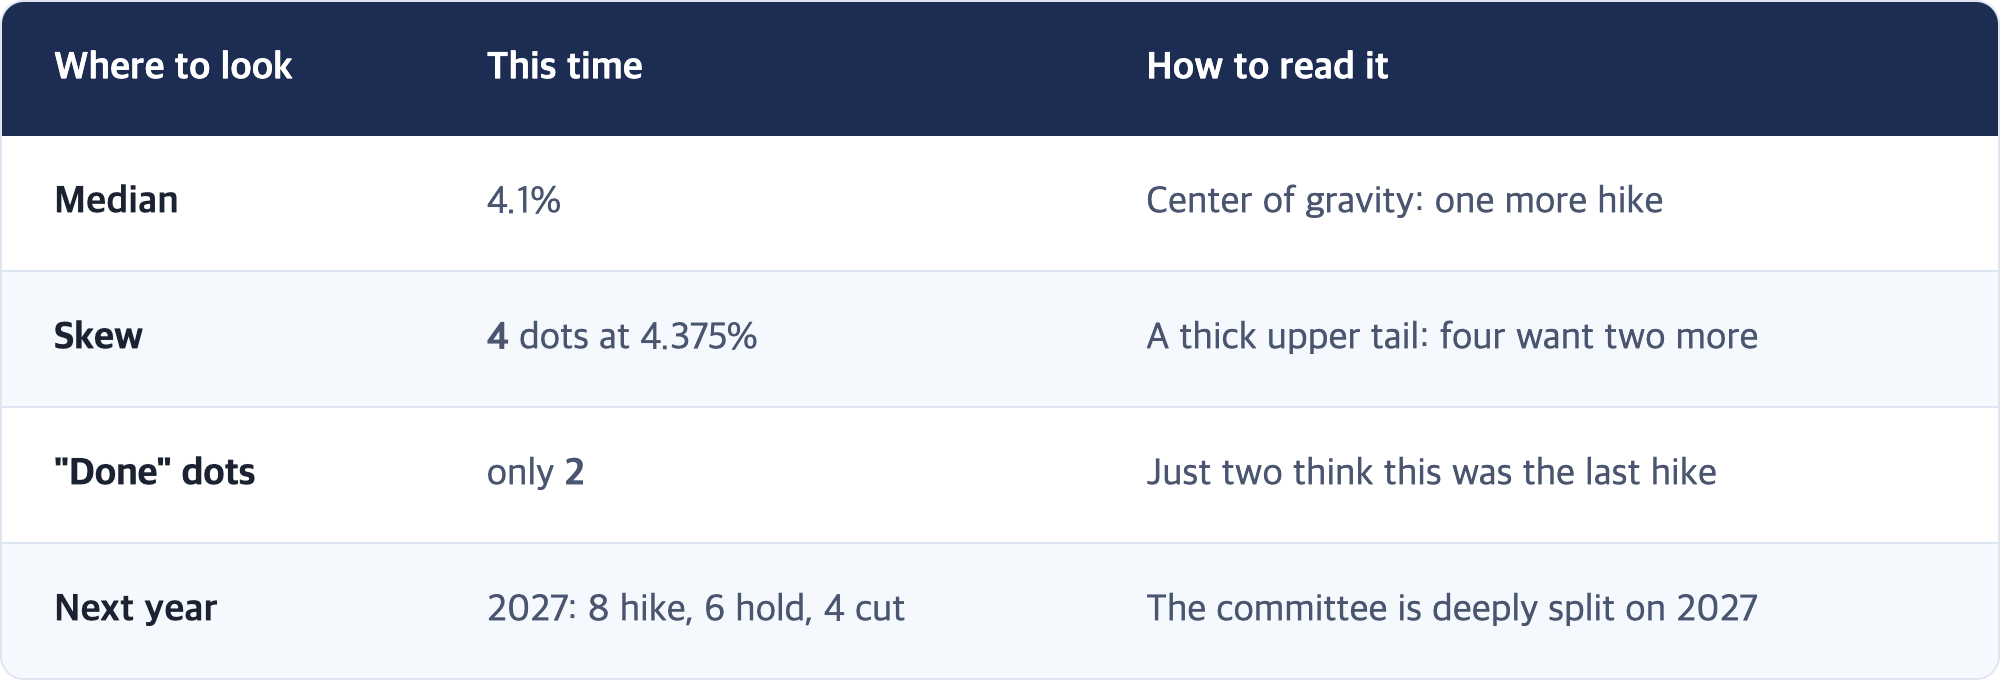
The most telling detail isn't the median but that only two dots say "done." Sixteen of eighteen want at least one more hike, which is why October odds have climbed to a coin flip.
One caveat
The dot plot is a forecast, not a promise. The end-2026 median was 3.8% in June and 4.1% three months later. One oil shock can move the dots. So after reading the dots, always check whether the 2-year yield believes them. This week it rose. The market believes them.
In one line
The median dot is what the middle official thinks; the real information is where the dots cluster, and whether the 2-year yield believes them.
7. Corrections and Open Items
🔴 Three missed editions and one delay
- 9/16 PM, 9/17 AM and 9/17 PM were not produced. This edition covers that gap. No Korea checkpoints were set for 9/17, so there is nothing to score for that session.
- This edition ran about six hours late (05:30 → 11:31 PDT); US figures are intraday.
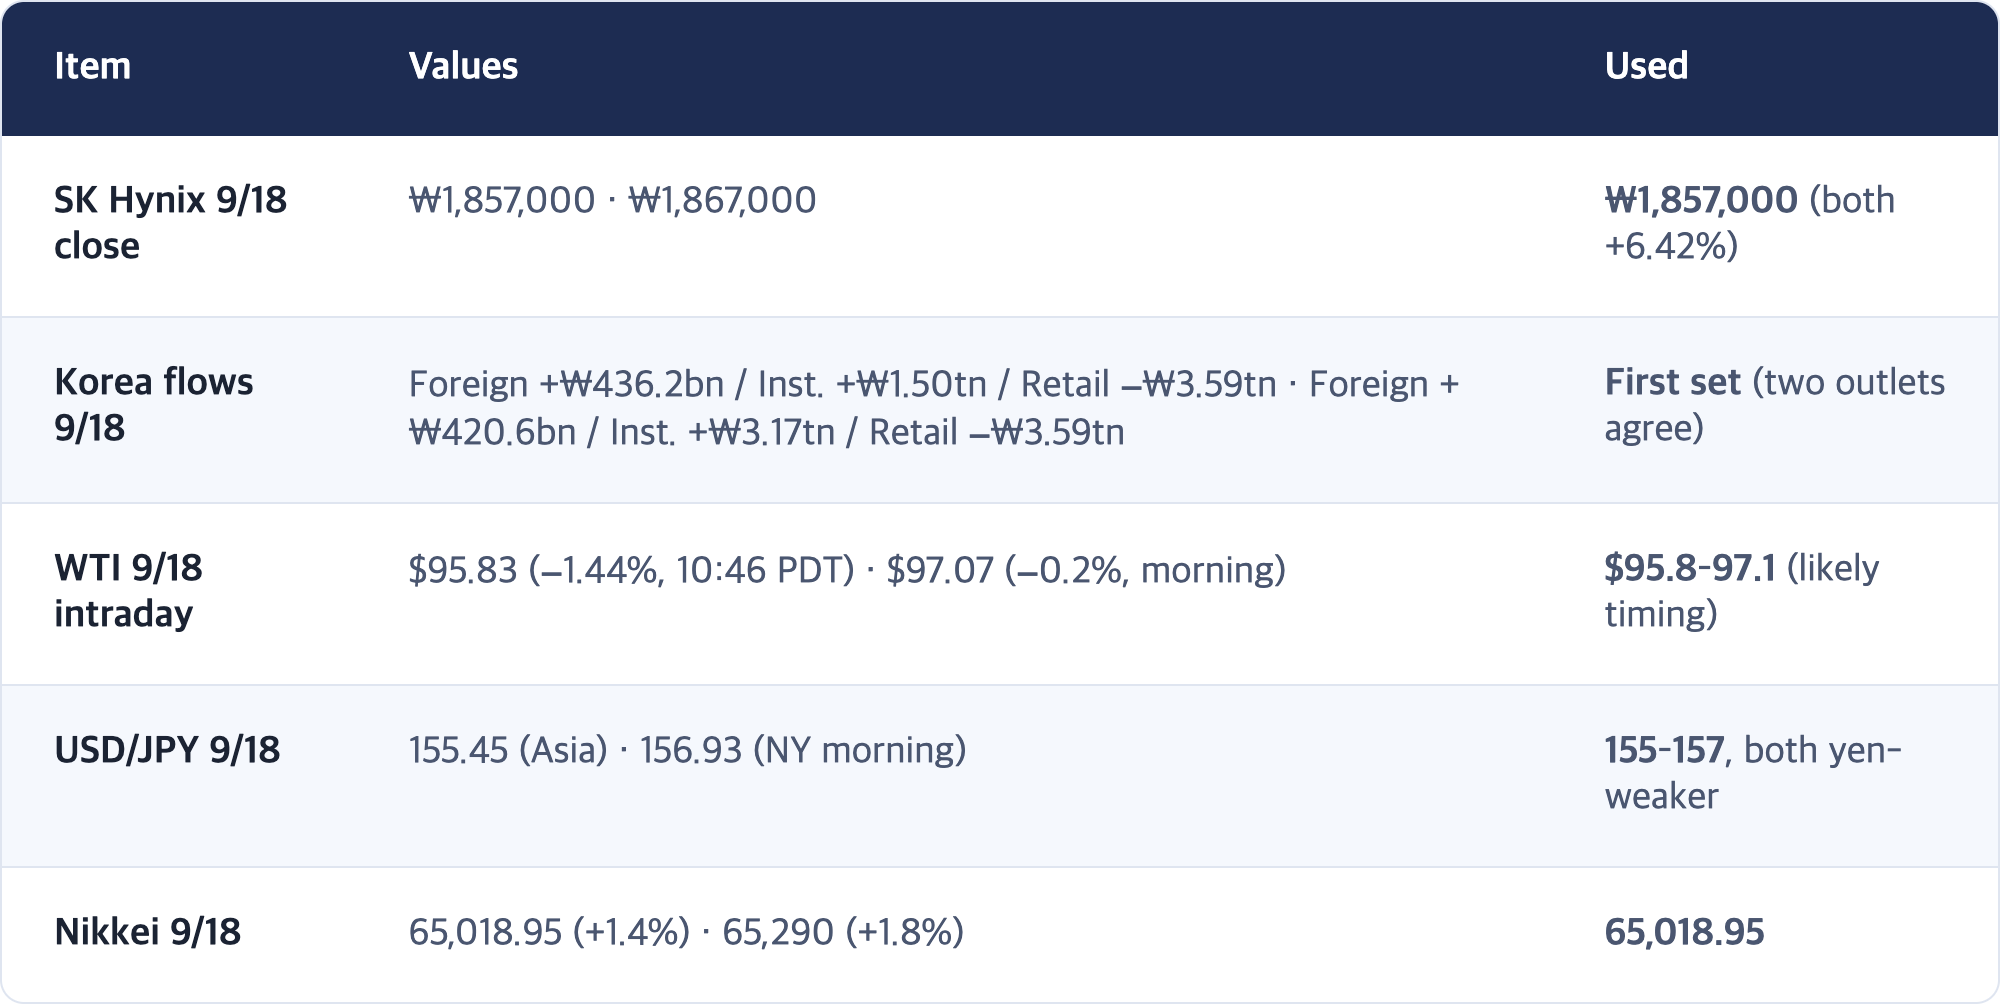
Source discrepancies (value used in the text)
Open items
- Nasdaq Composite 9/17 close is back-calculated (~26,418, ~+1.7%)
- 10-year and WTI 9/16 closes not secured (why checkpoints 3–4 are pending)
- SOX 9/16 and 9/17 closes not secured
- 🔴 Dollar Index (DXY) close: unresolved for eight editions running
- Korean government bond closes (9/17–9/18) and offshore USD/KRW NDF not secured
Sources
- Fed rate decision September 2026: Rates rise to 3.75%-4% (CNBC)
- Fed meeting live updates (Yahoo Finance)
- Fed Hikes in 12-0 Vote, Commits to Inflation Fight (Charles Schwab)
- Dot Plot Median Points to One More Hike This Year (TradingKey)
- Stock Market News for Sep 17, 2026 (Yahoo Finance)
- Stock market today, Sept 17 (Yahoo Finance)
- Stock market today, Sept 18 (Yahoo Finance)
- Stock Market Today, Sept. 18, 2026 (TheStreet)
- Bank of Japan raises interest rates to 31-year high (CNBC)
- Bank of Japan Hikes in a Split Vote; Yen Drops (Bloomberg)
- Asian stocks boosted by falling oil, yen weakens after BoJ hike (France 24 / AFP)
- Market Pulse, September 18, 2026 (NordFX)
- DAX Closes Sharply Lower (Trading Economics)
- KOSPI up 2.66% as foreigners turn buyers (Seoul Shinmun, Korean)
- KOSPI closes at 6,894.23 (Businesskorea, Korean)
- USD/KRW rises 1.1 won to 1,383.3 (Money Today, Korean)
- AI stocks sink while cybersecurity shares rally on slowdown fears (CNBC)
This brief is an interpretation of market trends and macro variables. It is not a recommendation to buy or sell any security.
📌 More market briefs
※ This post is market observation and organization intended to support your own judgment. It is not a recommendation to buy or sell any security. Figures are as of the time of writing and may differ between sources.
If this was useful, bookmark it or pass it along. It genuinely helps me write the next one.
I can survive. We can survive.